Copper theft in the US: insurance claims, the copper price link and 50 state scrap metal laws
- Data
- NICB ForeCAST metal theft claims (ISO ClaimSearch) and the ReMA State Metals Theft Statutes compendium
- Period
- Claims 2006 to 2018; copper price to September 2026; laws as compiled November 11, 2025, with 2025 and 2026 statute checks
- Release used
- 2019-10-29
- Next release
- None announced: NICB has published no metal theft claims for loss years after 2018
- Geography
- United States, 50 states and the District of Columbia
- Sources
- 30 (26 official)
Copper theft is widespread but no longer counted nationally: NICB metal theft insurance claims fell from 14,676 in 2011 to 2,887 in 2018, the last year in its public releases, and monthly claims tracked the copper price (r = 0.56, 2014 to 2017). All 50 states regulate scrap buyers; 11 ban cash for copper and 48 require seller ID.
50-state scrap metal law ledger for copper
Checked quarterly against ReMA's compendium and state legislature sites, and after each legislative session. Last checked 2026-10-27. Entries are neutral records of public data; each links to its source record.
| State | Statute and copper sale rules | Date | Evidence | Source |
|---|---|---|---|---|
| Alabama | Alabama Code Title 13A, Chapter 8, Article 1A; §13A-8-30 to §13A-8-39. Seller ID required; records kept 1 yr; hold: 15-day hold on written notice from police (30-day extension); cash: No cash over $50 for copper; $500 for other metal; infrastructure penalty: Possessing stolen utility access or manhole covers: Class C felony on first offense | 2022-06-01 | trade-body summary (ReMA compendium) | Record |
| Alaska | Alaska Statutes Ch.08.60, Art. 3; AS 08.60.200 to AS 08.60.290. Seller ID required; records kept 5 yr; hold: No hold provision listed; cash: No cash limit listed; infrastructure penalty: None identified in compendium | 2024-10-30 | trade-body summary (ReMA compendium) | Record |
| Arizona | Scrap Metal Dealers: ARS Title 44, Ch. 11, Art. 3.1; § 44.1641 to § 44-1649. Seller ID required; records kept 2 yr; hold: Automatic 7-day hold on reportable copper transactions; cash: No cash at $300 or more, none for AC coils or wire 3/8 in. or thicker; infrastructure penalty: Theft value includes damage caused by the theft | 2024-10-28 | trade-body summary (ReMA compendium) | Record |
| Arkansas | Scrap Metal Dealers: A.C.A. Title 17, Subtitle 2, Chapter 44; § 17-44-101 to § 17-44-109. Seller ID required; records kept 1 yr; hold: No hold provision listed; cash: No cash limit listed; infrastructure penalty: Theft of utility property worth $500 or more: Class B felony | 2023-08-30 | trade-body summary (ReMA compendium) | Record |
| California | Junk Dealers and Recyclers: Cal. Bus. & Prof. Code, Div. 8, Ch. 9, Art.3; § 21600 to § 21610. Seller ID required; records kept 2 yr; hold: 90-day hold on written notice from a peace officer; cash: Cash for nonferrous only after a 3-business-day wait; infrastructure penalty: Possessing stolen utility or public agency material: added fine up to $5,000 | 2025-10-27 | trade-body summary (ReMA compendium) | Record |
| Colorado | C.R.S. Title 18, Article 13, Section 111; § 18-13-111. Seller ID required; records kept 3 yr; hold: No hold provision listed; cash: $300 cash cap unless the seller is photographed at payment; HB26-1101 adds critical infrastructure metals; infrastructure penalty: HB26-1101 (2026): possessing critical infrastructure metal worth $2,000 or more without an affidavit: class 6 felony | 2026-05-07 | official text checked: HB26-1101 signed 05/07/2026 (Colorado General Assembly bill page); plus ReMA summary | Record |
| Connecticut | Junk Dealers: C.G.S. Title 21, Chapter 405; § 21-9 to § 21-14. Seller ID required; records kept 2 yr; hold: Dealers hold all goods 5 days after weekly report; cash: No cash limit for copper listed; infrastructure penalty: None identified in compendium | 2023-08-30 | trade-body summary (ReMA compendium) | Record |
| Delaware | Del. Code. Title 24, Chapter 23; 24 Del. C. § 2301 to § 2317. Seller ID required; records kept 1 yr; hold: Processors hold copper and brass 72 hours after electronic report; cash: No cash limit listed; infrastructure penalty: None identified in compendium | 2023-09-18 | trade-body summary (ReMA compendium) | Record |
| Florida | Secondary Metals Recyclers: Fla. Stat. Title XXXIII, Chapter 538, Part II; § 538.18 to § 538.21. Seller ID required; records kept 3 yr; hold: 15-day hold on written notice from police; cash: No cash over $1,000 for regulated metals; no cash for restricted regulated metals; infrastructure penalty: Recycler violations are felonies; no utility-specific enhancement listed | 2026-10-27 | official text checked: Fla. Stat. 538.235 (2026 Florida Statutes); plus ReMA summary | Record |
| Georgia | Ga. Code Ann. Title 10, Chapter 1, Article 14; § 10-1-350 to § 10-1-359.5. Seller ID required; records kept 2 yr; hold: 15-day hold on written notice from police; cash: No cash for regulated metal; infrastructure penalty: Felony, 1 to 10 years, when property damage exceeds $1,500 | 2025-10-22 | trade-body summary (ReMA compendium) | Record |
| Hawaii | Scrap Dealers: Haw. Rev. Stat. Tit. 25, Ch. 445, Part X; § 445-231 to § 445-235. Seller ID required; records kept 2 yr; hold: Hold applies to catalytic converters only; cash: No cash for copper; check mailed or picked up; infrastructure penalty: Theft of 1 lb or more of copper: Class C felony | 2026-10-27 | official text checked: HRS 708-835.7 (Internet Archive copy); plus ReMA summary | Record |
| Idaho | Idaho Code Ann. Title 54, Chapter 27; § 54-2701 to § 54-2708. Seller ID required; records kept 5 yr; hold: 5-business-day tag and hold on police notice; cash: No cash limit for individual sellers listed; infrastructure penalty: Felony to take nonferrous metal from a substation or utility facility | 2023-08-30 | trade-body summary (ReMA compendium) | Record |
| Illinois | Ill. Comp. Stat. Chapter 815, Act 325; 815 ILCS 325/1 to 815 ILCS 325/9. Seller ID required; records kept 3 yr; hold: No hold provision listed; cash: No cash over $100 for copper, AC coils or catalytic converters; infrastructure penalty: Repeat dealer violations: Class 4 felony; no utility enhancement listed | 2024-10-29 | trade-body summary (ReMA compendium) | Record |
| Indiana | IC Title 25, Article 37.5. Dealers in Valuable Metals; § 25-37.5-1-.01 to § 25-37.5-1-10. Seller ID required; records kept 2 yr; hold: 5-working-day hold on police notification; cash: No cash limit listed; infrastructure penalty: Level 5 felony if metal is taken from a utility, telecom or critical infrastructure facility | 2022-06-01 | trade-body summary (ReMA compendium) | Record |
| Iowa | Iowa Code Title 16, Chapter 714, Section 27; § 714.27. Seller ID required; records kept 2 yr; hold: No hold provision listed; cash: No cash over $50 for scrap metal; infrastructure penalty: None identified in compendium | 2024-10-28 | trade-body summary (ReMA compendium) | Record |
| Kansas | Kan. Stat. Ann. Chapter 50, Article 6, Section 109 to 112c; § 50-6,109 to § 50-6,112c. Seller ID required; records kept 2 yr; hold: 30-day hold on police notice; cash: No cash limit listed; infrastructure penalty: Aggravated criminal damage (over $5,000) to obtain scrap metal from infrastructure: severity level 6 felony | 2025-10-27 | trade-body summary (ReMA compendium) | Record |
| Kentucky | Ky. Rev. Stat. Ann. Title XL, Chapter 433; § 433.890 to § 433.896 and § 433.900 to § 433.906. Seller ID required; records kept 2 yr; hold: Automatic 3-business-day hold (item or photo); cash: No cash for restricted metals, including utility copper wire; infrastructure penalty: Damaging a key infrastructure asset: criminal mischief 1st degree, Class D felony | 2025-10-28 | trade-body summary (ReMA compendium) | Record |
| Louisiana | La. Rev. Stat. Ann. Title 37. Professions and Occupations: . Seller ID required; records kept 3 yr; hold: No hold provision listed; cash: No cash for copper; check after 5 business days; infrastructure penalty: None identified in compendium | 2023-08-30 | trade-body summary (ReMA compendium) | Record |
| Maine | Maine Revised Statutes Title 30-A, Chapter 183, Subchapter 1-A; 30-A §3771 to 30-A §3778. Seller ID required; records kept 1 yr; hold: 7-day hold on written police order; cash: No cash payments to sellers; infrastructure penalty: None identified in compendium | 2024-09-27 | trade-body summary (ReMA compendium) | Record |
| Maryland | Md. Code, Business Regulation, Title 17, Subtitle 10; § 17-1001 to § 17-1013. Seller ID required; records kept 1 yr; hold: Up to 15-day hold on written police notice; cash: No cash limit listed; infrastructure penalty: None identified in compendium | 2024-10-08 | trade-body summary (ReMA compendium) | Record |
| Massachusetts | Copper: Mass. Gen. Laws § 266-142. No seller ID for copper; retention not specified; hold: No hold provision listed for copper; cash: No cash limit for copper listed; infrastructure penalty: None identified in compendium | 2023-02-08 | trade-body summary (ReMA compendium) | Record |
| Michigan | Scrap Metal: MCL Ch. 445, Act 429 of 2008; § 445.421 to § 445.443. Seller ID required; records kept 1 yr; hold: 7-day tag and hold when a police bulletin or missing ownership record applies; cash: Payment by check, money order or camera-equipped ATM card; infrastructure penalty: Theft value counts repair costs; treble civil damages | 2019-09-30 | trade-body summary (ReMA compendium) | Record |
| Minnesota | Minnesota Statutes Chapter 325E, Section 21; § 325E.21-1 to § 325E.21-15. Seller ID required; records kept 3 yr; hold: 30-day hold on police notification; cash: Check or electronic transfer only (Minn. Stat. 325E.21); infrastructure penalty: None identified in compendium | 2026-10-27 | official text checked: Minn. Stat. 325E.21; plus ReMA summary | Record |
| Mississippi | Miss. Code Ann. Title 97, Chapter 17, Section 71; § 97-17-71 to § 97-17-71.2. Seller ID required; records kept 2 yr; hold: 15-day hold on written police notice; cash: No payment for 3 days; check or electronic transfer; infrastructure penalty: Felony, 3 to 20 years, when value plus repair costs exceed $25,000 | 2022-06-01 | trade-body summary (ReMA compendium) | Record |
| Missouri | Mo. Rev. Stat. Title XXVI, Chapter 407, § 407.297 to § 407.305. Seller ID required; records kept 3 yr; hold: Hold applies to catalytic converters only; cash: Payments of $500 or more by check or camera-equipped system; infrastructure penalty: Stealing telecom or electrical wire or transformers: Class C felony (RSMo 570.030) | 2025-08-28 | official text checked: RSMo 570.030 (effective Aug 28, 2025); plus ReMA summary | Record |
| Montana | Mont. Code Ann. Title 30, Chapter 22; § 30-22-101 to § 30-22-103. Seller ID required; records kept 2 yr; hold: No hold provision listed; cash: No cash limit listed; infrastructure penalty: Up to 10 years and $50,000 when damage is $1,500 or more | 2023-08-30 | trade-body summary (ReMA compendium) | Record |
| Nebraska | Neb. Rev. Stat. Chapter 69, Article 4, Section 401-409; § 69-401 to § 69-409. Seller ID required; records kept 1 yr; hold: No hold provision listed; cash: No cash for copper; $25 cap for other metal; infrastructure penalty: None identified in compendium | 2019-09-30 | trade-body summary (ReMA compendium) | Record |
| Nevada | Nevada Revised Statutes Chapter 647; § 647.010 to §647.145. Seller ID required; records kept 3 (utility wire) yr; hold: 7-business-day hold on written police request; cash: Cash under $150 only, one cash deal per seller per day; infrastructure penalty: AB 503 (2025): tampering with critical infrastructure; Category C felony if service is interrupted | 2025-10-29 | trade-body summary (ReMA compendium) | Record |
| New Hampshire | N.H. RSA Chapter 322; § 322:1 to § 322:16. Seller ID required; records kept 2 yr; hold: Hold applies to catalytic converters only; cash: No cash limit for copper listed; infrastructure penalty: None identified in compendium | 2024-10-29 | trade-body summary (ReMA compendium) | Record |
| New Jersey | N.J. Rev. Stat. Title 45, Subtitle 2, Ch. 28; § 45:28-1 to § 45:28-5. Seller ID required; records kept 5 yr; hold: No hold provision listed; cash: No cash limit listed; infrastructure penalty: None identified in compendium | 2023-08-30 | trade-body summary (ReMA compendium) | Record |
| New Mexico | N.M. Stat. Ann. Chapter 57, Article 30; § 57-30-1 to § 57-30-14. Seller ID required; records kept 1 yr; hold: Automatic 24-hour hold on regulated material; cash: No cash limit listed; infrastructure penalty: Theft causing damage valued at $2,500 or more: 4th degree felony | 2023-08-30 | trade-body summary (ReMA compendium) | Record |
| New York | Scrap Metal Processor: N.Y. G.B.S. Law Article 6-C; § 69-e to § 69-h. Seller ID required; records kept 3 yr; hold: Junk dealers tag and hold items 5 days; cash: No cash limit listed; infrastructure penalty: None identified in compendium | 2022-10-24 | trade-body summary (ReMA compendium) | Record |
| North Carolina | N.C.G.S. Chapter 66, Article 45, Part 3. Regulation of Sales and Purchases of Metals. §66-420 to §66-431. Seller ID required; records kept 2 yr; hold: 15-day hold on written police notice; cash: No cash for copper; $100 cap for other nonferrous; infrastructure penalty: Repeat violations: Class I felony; no utility enhancement listed | 2021-09-23 | trade-body summary (ReMA compendium) | Record |
| North Dakota | N.D. Cent. Code Tit. 51, Ch. 35; § 51-35-01 to § 51-35-04. Seller ID required; records kept 7 yr; hold: No hold provision listed; cash: No cash over $1,000; infrastructure penalty: None identified in compendium | 2023-08-30 | trade-body summary (ReMA compendium) | Record |
| Ohio | Scrap Metal: Ohio Rev. Code Title 47, Ch. 4737; § 4737.01 to § 4737.99. Seller ID required; records kept 1 yr; hold: 30-day hold applies to railroad material only; cash: Check only, 2-day delay, for special purchase articles; infrastructure penalty: None identified in compendium | 2019-09-30 | trade-body summary (ReMA compendium) | Record |
| Oklahoma | Okla. Stat. Title 2, Ch. 1, Article 11, Oklahoma Scrap Metal Dealers Act; 2 O.S. § 11-90 to 2 O.S. § 11-99. Seller ID required; retention not specified; hold: No hold provision listed; cash: $1,000 cash cap for regulated items (utility and public property); infrastructure penalty: Entering an easement or right of way to steal copper wire: Class D1 felony | 2025-11-10 | trade-body summary (ReMA compendium) | Record |
| Oregon | Or. Rev. Stat. Ch. 165 and Ch. 164; § 165.116 to § 165.127, § 164.095, and § 164.857. Seller ID required; records kept 1 yr; hold: 10-day hold on police request; cash: No cash to individual sellers; payment after 3 business days; infrastructure penalty: None identified in compendium | 2021-07-30 | trade-body summary (ReMA compendium) | Record |
| Pennsylvania | Scrap Material Theft Prevention Act: Unofficial Purdon's Pennsylvania Statutes: PA ST 73 P.S., Ch. 27A; § 1943.1 to § 1943.8; Pa. Unconsolidated Statu. Seller ID required; records kept 2 yr; hold: 48-hour tag and hold on police notification; cash: No cash limit; cash sales need signed receipt; infrastructure penalty: None identified in compendium | 2022-11-04 | trade-body summary (ReMA compendium) | Record |
| Rhode Island | Regulated Metals: R.I. Gen. Laws Tit. 6, Ch. 11.2; § 6-11.2-1 to § 6-11.2-17. Seller ID required; records kept 2 yr; hold: Automatic 3-day hold on restricted regulated metal; cash: No cash limit listed; infrastructure penalty: None identified in compendium | 2022-09-28 | trade-body summary (ReMA compendium) | Record |
| South Carolina | Nonferrous – S.C. Code Ann. Title 16, Ch. 17, Section 680; § 16-17-680. Seller ID required; records kept 1 yr; hold: 15-day hold on written police notice; cash: No cash of $25 or more for copper; infrastructure penalty: Disrupting service to critical infrastructure or 10+ customers: up to 3 years; great bodily injury: up to 15 years | 2021-07-30 | trade-body summary (ReMA compendium) | Record |
| South Dakota | S.D. Codified Laws Title 34A, Chapter 6; § 34A-6-107 to § 34A-6-112. Seller ID required; records kept 1 yr; hold: Up to 10-business-day tag and hold on police request; cash: No cash over $100 for nonferrous metal; infrastructure penalty: None identified in compendium | 2022-06-01 | trade-body summary (ReMA compendium) | Record |
| Tennessee | Scrap Metal Dealers: Tenn. Code Ann. § 62-9-101 to § 62-9-116. Seller ID required; records kept 3 yr; hold: No hold provision listed; cash: No cash for copper or AC coils; infrastructure penalty: None identified in compendium | 2025-10-27 | trade-body summary (ReMA compendium) | Record |
| Texas | Texas Occupations Code, Title 12, Subtitle B, Ch. 1956; § 1956.001 to § 1956.204. Seller ID required; records kept 2 yr; hold: 8-day hold on listed items; 60-day police hold; cash: Cash only to holders of a state cash transaction card; infrastructure penalty: Damaging copper or brass of a critical infrastructure facility: 3rd degree felony; theft graded one level higher | 2025-11-10 | trade-body summary (ReMA compendium) | Record |
| Utah | Metal Dealers: Utah Code Title 76, Ch. 6, Part 14 Regulation of Metal Dealers; § 76-6-1401 to § 76-6-1409. Seller ID required; records kept 3 yr; hold: 60-day hold on written police notice; cash: No cash limit listed; infrastructure penalty: None identified in compendium | 2025-10-29 | trade-body summary (ReMA compendium) | Record |
| Vermont | Vt. Stat. Ann. Title 9, Part 4, Chapter 82; 9 V.S.A. § 3021 to § 3023. Seller ID required; records kept 5 yr; hold: 10-day hold when seller lacks ownership papers; cash: No cash limit listed; infrastructure penalty: None identified in compendium | 2023-08-30 | trade-body summary (ReMA compendium) | Record |
| Virginia | Va. Code Ann. Title 59.1, Chapter 9, Article 4; § 59.1-136.1 to § 59.1-136.7. Seller ID required; records kept 5 yr; hold: 15-day hold on proprietary articles bought without papers; cash: No cash limit listed; infrastructure penalty: None identified in compendium | 2023-08-30 | trade-body summary (ReMA compendium) | Record |
| Washington | Wash. Rev. Code Title 19, Chapter 19.290; § 19.290.010 to § 19.290.901. Seller ID required; records kept 5 yr; hold: Up to 10-business-day tag and hold on police notice; cash: No cash for nonferrous metal, or up to $30 with extra records; infrastructure penalty: Theft graded by damage cost: 1st degree over $5,000 | 2024-11-06 | trade-body summary (ReMA compendium) | Record |
| West Virginia | Scrap Metal: W. Va. Code Ch. 61, Article 3; § 61-3-49 and § 61-3-49b. Seller ID required; records kept 3 yr; hold: Hold applies to catalytic converters only; cash: No cash limit for copper listed; infrastructure penalty: Disrupting utility service to 10+ households: felony on 2nd offense, 1 to 10 years on 3rd (W. Va. Code 61-3-49b) | 2026-10-27 | official text checked: W. Va. Code 61-3-49b (Internet Archive copy); plus ReMA summary | Record |
| Wisconsin | Wis. Stat. Ch. 134, Sec. 405; § 134.405. Seller ID required; records kept 2 yr; hold: No hold provision listed; cash: No cash limit listed; infrastructure penalty: Theft value includes repair costs for scrap metal | 2024-09-27 | trade-body summary (ReMA compendium) | Record |
| Wyoming | Wyo. Stat. Title 33, Chapter 18; § 33-18-101 to § 33-18-106. Seller ID or vehicle plate; retention not specified; hold: No hold provision listed; cash: No cash limit listed; infrastructure penalty: None identified in compendium | 2019-09-30 | trade-body summary (ReMA compendium) | Record |
Copper theft claims fell 80% from 2011 to 2018, the last year of national data
The only national, repeated count of copper theft is NICB's analysis of insurance claims in ISO ClaimSearch. It rose to a 2011 peak, fell steeply after states tightened scrap laws, and stops in 2018.
NICB identified 13,861 metal theft claims from January 2006 to November 2008, 25,083 for 2009 to 2011 and 33,775 for 2010 to 2012, with copper in 96% of the 2010 to 2012 claims (NICB, May 2013).
Annual counts peaked at 14,676 claims in 2011 and fell every year after 2013, reaching 2,887 claims in 2018 (NICB, October 2019). The fall from 2011 to 2018 is 80.3%.
Latest NICB vintage per loss year
Source: NICB ForeCAST metal theft reports, 2014 to 2019 releases
| Loss year | Claims (latest NICB vintage) | Release used | Other published counts for the same year |
|---|---|---|---|
| 2011 | 14,676 | May 2014 | none |
| 2012 | 13,731 | 2015 release | 13,603 (May 2014) |
| 2013 | 13,626 | 2016 release | 13,632 (2015); 10,807 (May 2014) |
| 2014 | 12,682 | March 2019 | 12,630 (2015 and 2017); 12,621 (2016) |
| 2015 | 7,995 | March 2019 | 9,699 (2017); 9,692 (2016) |
| 2016 | 4,063 | March 2019 | 5,103 (2017) |
| 2017 | 3,017 | October 2019 | 2,774 (March 2019) |
| 2018 | 2,887 | October 2019 | none |
Latest published vintage used for each year. Source: NICB ForeCAST reports and releases, 2014 to 2019.
Source: [1][2][6][7][8][9] National Insurance Crime Bureau (NICB); National Insurance Crime Bureau (NICB); National Insurance Crime Bureau (NICB); National Insurance Crime Bureau (NICB); National Insurance Crime Bureau (NICB); National Insurance Crime Bureau (NICB)
Claims capture insured losses only. A theft from an uninsured vacant house, or one absorbed by a utility or carrier, never reaches the database, and NICB itself says comprehensive empirical data is elusive (NICB, 2013).
The widely repeated cost of about $1 billion a year comes from a 2007 U.S. Department of Energy estimate cited by NICB (NICB, 2019). We could not open the 2007 DOE original, so the figure is shown as a secondary citation only.
New Jersey, Pennsylvania and Ohio filed the most metal theft claims in 2017 to 2018
The claims cluster in older industrial metros of the Northeast and Midwest. Per resident, Connecticut, New Jersey and Rhode Island rank highest.
Two-year rate
Source: NICB, Metal Theft Claims 2017 to 2018 (October 2019), state table
| State | Claims 2017 to 2018 | Claims per 100,000 (2017 to 2018) | Rank per capita | Claims 2014 | Claims 2017 | Change 2014 to 2017 |
|---|---|---|---|---|---|---|
| New Jersey | 570 | 6.4 | 2 | 993 | 307 | -69.1% |
| Pennsylvania | 488 | 3.8 | 6 | 1,068 | 254 | -76.2% |
| Ohio | 410 | 3.5 | 7 | 1,485 | 208 | -86.0% |
| New York | 405 | 2.1 | 21 | 821 | 187 | -77.2% |
| Illinois | 333 | 2.6 | 13 | 633 | 173 | -72.7% |
| Texas | 280 | 1.0 | 34 | 610 | 129 | -78.9% |
| California | 261 | 0.7 | 45 | 526 | 111 | -78.9% |
| Maryland | 257 | 4.3 | 5 | 555 | 113 | -79.6% |
| Connecticut | 244 | 6.8 | 1 | 494 | 116 | -76.5% |
| North Carolina | 186 | 1.8 | 23 | 413 | 96 | -76.8% |
| Massachusetts | 177 | 2.6 | 15 | 375 | 88 | -76.5% |
| Missouri | 175 | 2.9 | 9 | 364 | 75 | -79.4% |
| Georgia | 168 | 1.6 | 28 | 451 | 67 | -85.1% |
| Michigan | 161 | 1.6 | 26 | 544 | 93 | -82.9% |
| Alabama | 135 | 2.8 | 10 | 196 | 65 | -66.8% |
Per 100,000 is NICB's two-year rate using 2018 Census estimates. 2014 and 2017 counts are from NICB's March 2019 dataset.
Source: [1][2] National Insurance Crime Bureau (NICB); National Insurance Crime Bureau (NICB)
The New York-Newark-Jersey City metro area had the most claims of any metro in 2017 to 2018 with 415 (NICB, 2019). The median state rate was 1.6 claims per 100,000 residents over the two years.
NICB's October 2019 release and chart give Connecticut 13.8 claims per 100,000 residents, the report text says 23.0, and the state table says 6.8. Only the table value can be reproduced from the published counts (244 claims, 3,572,665 residents), so the map and table use the table values.
Telecom carriers now report more copper theft incidents than insurers once did
Since NICB stopped publishing, the largest current numbers come from communications providers. Electric utility figures are older, and federal agencies have issued statements rather than counts.
| Reporter | Measure | Value | Period | Geography | Tier |
|---|---|---|---|---|---|
| NCTA-led industry survey | Intentional theft and vandalism incidents, communications networks | 5,770 | June to December 2024 | US | 2 |
| NCTA-led industry survey | Customers affected | more than 1.5 million | June to December 2024 | US | 2 |
| NCTA-led industry survey | Incidents typed as copper and cable theft / cuts into copper and fiber | 251 / 1,915 | June to December 2024 | US | 2 |
| AT&T (via Light Reading) | Copper theft incidents | more than 10,400 | 2025 | US | 3 |
| AT&T (via Light Reading) | Estimated losses | about $82 million | 2025 | US | 3 |
| AT&T (via Light Reading) | Incidents / losses in California | more than 7,300 / about $54 million | 2025 | California | 3 |
| ESFI survey cited by DOE | Copper theft incidents at 618 electric utilities | 18,400 | 2008 | US | 1 (DOE report) |
| ESFI survey cited by DOE | Repair costs | $22 million | 2008 | US | 1 (DOE report) |
| DOE Energy Assurance Daily | Large outages (10,000+ customers) caused by copper wire theft | 25 of 2,021 | about 2005 to 2010 | US | 1 |
Tier 1 = government; Tier 2 = trade body survey; Tier 3 = company figures reported by trade press.
Source: [16][19][20] U.S. Department of Energy, Office of Electricity Delivery and Energy Reliability; NCTA, The Internet and Television Association, with telecom industry partners; Light Reading (Informa)
Communications providers reported 5,770 intentional theft and vandalism incidents from June to December 2024, an average of 824 a month or 27 a day, and the attacks disrupted service for more than 1.5 million customers (NCTA, 2025). Ten states accounted for 93% of the incidents.
The NCTA survey covers participating providers only and its authors say the true number is likely higher. On average each outage affected about 2,000 customers and lasted 138 hours (NCTA, 2025).
AT&T said it logged more than 10,400 copper theft incidents in 2025, about 200 a week, with losses of about $82 million (Light Reading, April 2026). That is roughly $7,885 per incident. These are company figures reported by trade press and are Tier 3 here.
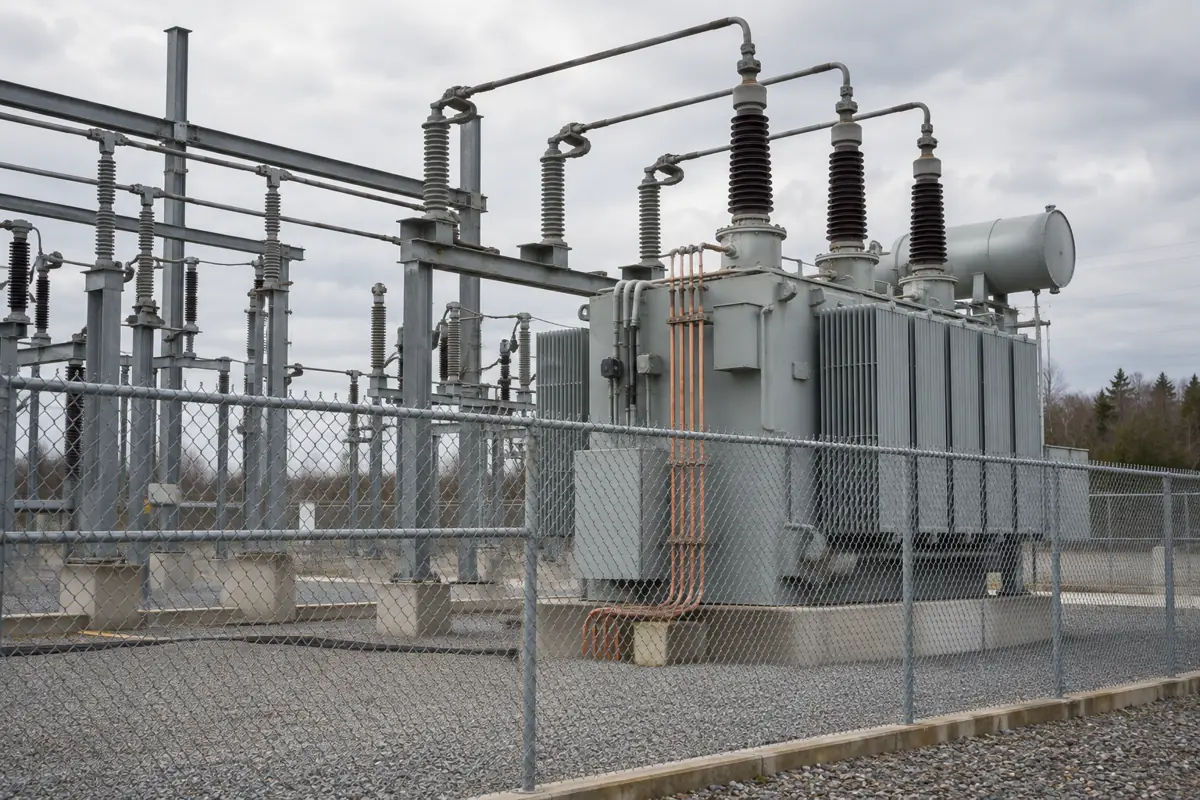
For electric utilities, the Department of Energy's 2010 assessment found 25 of 2,021 large outages (10,000 or more customers) over five years were caused by copper wire theft, about 1% (DOE, 2010). A thief typically took copper worth several hundred dollars while the utility spent just over $1,000 on repairs.
- FBI (2008, via NICB 2012): an unclassified intelligence assessment said copper thieves threaten US critical infrastructure and present a risk to public safety and national security.
- DOE (2010): copper theft legislation had passed in all but five states, 45 in total, by August 2010.
- DOE Inspector General (2011): one investigation found up to 30,000 pounds of copper stolen by contractor employees at a Los Alamos National Laboratory facility.
- FCC (October 2025): Commissioner Olivia Trusty called theft and vandalism of communications networks a growing epidemic and cited at least 5,770 incidents in 2024.
Outage effects on the grid are tracked separately in our power outages by state report, and electrocution risks to people who cut live conductors are covered in electrical injury statistics.
Claims tracked the copper price until state laws took hold
Insured theft claims and the copper price fell together from 2014 to 2016, which produces a high correlation. The short-run link is weak, and claims kept falling when the price recovered in 2017 and 2018.
January 2014 to December 2017
Source: NICB 2019 metal theft dataset; IMF Primary Commodity Prices via FRED (PCOPPUSDM)
Across 48 months from January 2014 to December 2017, monthly NICB claims and the IMF global copper price correlate at r = 0.56 (NICB dataset; FRED). NICB, using a different price source, reported 0.55 for the same period.
Month-to-month changes correlate at only r = 0.11. With the price leading by three months the level correlation rises to 0.75. On eight annual points for 2011 to 2018 it is 0.77. NICB's earlier report for 2014 to 2016 found 0.902, and its 2017 to 2018 report found 0.47.
| Year | Metal theft claims | Average copper price (US$ per metric ton) | Claims per $1,000/t of price |
|---|---|---|---|
| 2011 | 14,676 | 8,823.5 | 1,663.3 |
| 2012 | 13,731 | 7,958.9 | 1,725.2 |
| 2013 | 13,626 | 7,331.5 | 1,858.6 |
| 2014 | 12,682 | 6,863.4 | 1,847.8 |
| 2015 | 7,995 | 5,510.5 | 1,450.9 |
| 2016 | 4,063 | 4,867.9 | 834.7 |
| 2017 | 3,017 | 6,169.9 | 489.0 |
| 2018 | 2,887 | 6,529.8 | 442.1 |
| 2019 | not published | 6,010.1 | n/a |
| 2020 | not published | 6,174.6 | n/a |
| 2021 | not published | 9,317.4 | n/a |
| 2022 | not published | 8,828.9 | n/a |
| 2023 | not published | 8,490.8 | n/a |
| 2024 | not published | 9,142.1 | n/a |
| 2025 | not published | 9,946.9 | n/a |
| 2026 (Jan to Sep) | not published | 13,418.7 | n/a |
Price: annual average of monthly PCOPPUSDM values. Claims: latest NICB vintage. No claims published after 2018.
Source: [13][1][2][7][8][9] International Monetary Fund via FRED, Federal Reserve Bank of St. Louis; National Insurance Crime Bureau (NICB); National Insurance Crime Bureau (NICB); National Insurance Crime Bureau (NICB); National Insurance Crime Bureau (NICB); National Insurance Crime Bureau (NICB)
The price has since moved far above the range in the claims data. The annual average was $8,824 per metric ton in 2011, the peak claims year, and $9,947 in 2025; January to September 2026 averaged $13,419. Monthly price history and wire cost effects are in our copper wire price index.
11 states ban cash for copper and 48 require a seller ID
Every state regulates scrap buyers, but the rules differ widely. The ledger above codes each state's ID, record, hold, cash and penalty rules from ReMA's November 2025 compendium, with key statutes checked on official legislature sites.
| Provision (copper sales by individuals) | States | Notes |
|---|---|---|
| Seller ID recorded or copied | 48 | Wyoming: ID or vehicle plate; Massachusetts: name and address only for copper |
| No cash at any amount | 11 | check, electronic transfer or delayed payment instead |
| Dollar cap on cash | 12 | from $25 in South Carolina to $1,000 in North Dakota |
| Cash only after a waiting period | 1 | California, 3 business days |
| Cash limits only for utility or restricted items | 3 | Kentucky, Ohio, Oklahoma |
| Cash only with a state cash transaction card | 1 | Texas |
| No cash rule found | 22 | |
| Automatic hold that can cover copper | 11 | 24 hours (New Mexico) to 15 days (Virginia, items without papers) |
| Hold only on police request | 19 | 48 hours (Pennsylvania) to 90 days (California) |
| Hold limited to catalytic converters or railroad material | 5 | |
| Infrastructure-specific criminal penalty | 14 | from ReMA compendium and statutes checked on official sites |
| Theft graded by repair or damage cost | 8 |
Coded from ReMA's November 2025 compendium and workbooks; Colorado, Florida, Hawaii, Minnesota, Missouri and West Virginia checked against official text.
Source: [14][15][25][26][27][28][29][30] Recycled Materials Association (ReMA, formerly ISRI); Recycled Materials Association (ReMA); Florida Legislature; Minnesota Office of the Revisor of Statutes; Hawaii State Legislature; Missouri Revisor of Statutes; West Virginia Legislature; Colorado General Assembly
50 states, ReMA coding as of November 2025
Source: ReMA State Metals Theft Statutes (Nov. 11, 2025); Electrical Contractors and Wiring coding
Cash limits for copper range from a ban in states such as Georgia, Louisiana, Minnesota and Tennessee to caps of $25 in South Carolina, $50 in Alabama and Iowa, and $1,000 in Florida and North Dakota (ReMA, 2025; Fla. Stat. 538.235).
The heaviest penalties we found tie the sentence to infrastructure or to repair costs rather than to the scrap value of the metal:
- Mississippi: 3 to 20 years when the value of the metal plus repair costs exceeds $25,000.
- South Carolina: up to 15 years if a nonferrous metal violation causes great bodily injury; up to 3 years for disrupting service to critical infrastructure or more than 10 customers.
- Montana: up to 10 years and a $50,000 fine when damage reaches $1,500 or more.
- Texas: damaging a copper or brass component of a critical infrastructure facility is a third degree felony, and theft of such copper is graded one level higher.
- West Virginia: disrupting utility service to 10 or more households is a felony on a second offense, with 1 to 10 years for a third (W. Va. Code 61-3-49b).
- Missouri: stealing wire or transformers used for telecom or electricity is a class C felony at any value (RSMo 570.030).
- Hawaii: theft of 1 pound or more of copper is a class C felony (HRS 708-835.7).
Colorado is the newest change in the ledger: HB26-1101, signed May 7, 2026, extends the state's commodity metal rules to critical infrastructure material and bars cash unless the seller is photographed or the sale is under $300 (Colorado General Assembly). Code adoption and licensing questions are covered on our code pages.
Jobsite theft: 11,574 pieces of heavy equipment stolen in 2016 and 21% recovered
There is no national count of building wire stolen from construction sites. The closest public measures are NCIC heavy equipment theft reports and the commercial share of NICB metal theft claims.
| Year | Heavy equipment thefts reported to NCIC | Share recovered | Release |
|---|---|---|---|
| 2008 | 13,511 | n/a | NICB, Oct. 2013 |
| 2010 | 13,374 | n/a | NER/NICB, July 2011 |
| 2011 | 11,705 | n/a | NER/NICB, Aug. 2012 |
| 2012 | 10,925 | n/a | NICB, Oct. 2013 |
| 2013 | 11,486 | n/a | NICB, Oct. 2014 |
| 2014 | 11,625 | 23% | NICB, Oct. 2015 |
| 2016 | 11,574 | 21% | NER/NICB 2016 report |
2009 and 2015 counts not found in the releases we could open. Recovery shares as stated by NICB.
Source: [21][22][23][24] National Equipment Register (Verisk) and National Insurance Crime Bureau; National Insurance Crime Bureau (NICB); National Insurance Crime Bureau (NICB); National Insurance Crime Bureau (NICB)
Selected years with published counts
Source: NICB and NER heavy equipment theft reports, 2011 to 2017 releases
NCIC received 11,574 heavy equipment theft reports in 2016 and recorded 2,442 recoveries, a 21% recovery rate; Texas alone had 2,375 thefts, 20.5% of the total (NER and NICB, 2016 report). Estimates of the annual cost of equipment theft range from $300 million to $1 billion, most near $400 million, excluding stolen tools and building materials.
Wire is a minority of insured metal theft. Loss descriptions mentioned wire or wiring in 773 of 5,904 claims in 2017 to 2018 (13.1%) and in 3,527 of 27,514 claims in 2014 to 2017 (12.8%); pipe and plumbing terms were more common (NICB, 2019).
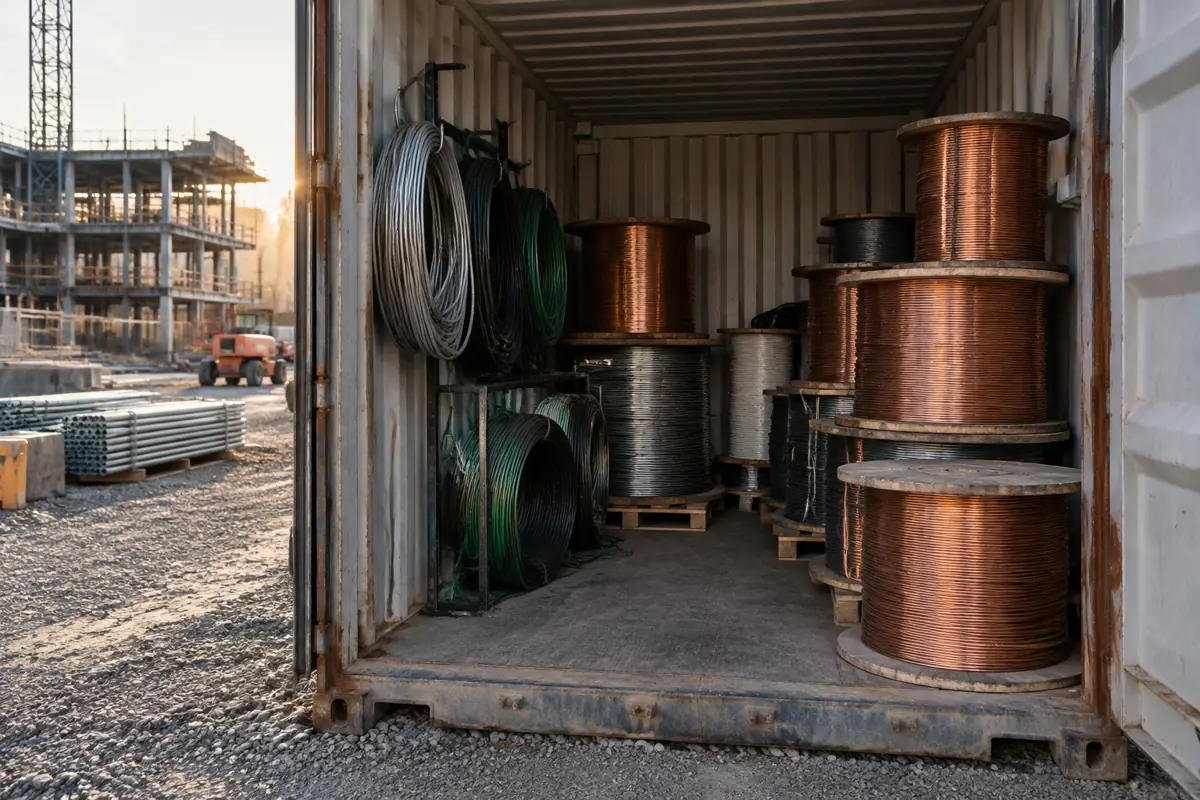
NICB has named construction sites as frequent victims because metal is often left on site unguarded (NICB, 2019). Builder's risk and inland marine cover for stored wire is discussed in our electrical contractor insurance requirements report, and business-side context is on our business pages.
Counts from the ledger
NICB metal theft claims by year and top states
Formulalatest NICB vintage per loss year; change = (2018 / 2011) - 1; top-five share = sum(top 5 states) / national total
Inputs: rows F03, F15 to F18, F26 to F28, F01, table t2 (fact sheet rows)
Result: 2011: 14,676; 2018: 2,887; change 80.3% down. Top five states held 37.4% of 2017 to 2018 claims.
The national claim count shrank by about four fifths in seven years, and the remaining claims concentrate in the Northeast and Midwest.
Limitations: Counts mix report vintages of a live database; insured losses only; no data after 2018.
Claims vs copper price correlation
FormulaPearson r of monthly claims and monthly IMF price (n = 48); also first differences, 3-month price lead and annual points
Inputs: NICB 2019 dataset (row F14), FRED PCOPPUSDM (row F34) (fact sheet rows)
Result: level r = 0.56; changes r = 0.11; 3-month lead r = 0.75; annual 2011 to 2018 r = 0.77
Theft claims and the price share a trend, and the price may lead claims by a few months, but month-to-month moves are nearly unrelated.
Limitations: Short window; world benchmark price rather than US scrap prices; no control for state law changes; correlation is not causation.
Theft intensity per unit of copper price
Formulaannual claims / (annual average price / 1,000)
Inputs: rows F03, F26, F34 (fact sheet rows)
Result: 1,858.6 claims per $1,000/t in 2013; 442.1 in 2018; down 76.2%
Per dollar of copper price, insured theft claims fell by about three quarters, which fits the view that something other than price, such as scrap laws, pushed claims down.
Limitations: Ratio of two unrelated units used only as an index; sensitive to vintage differences.
50-state scrap metal law counts
Formulacount of ledger rows by coded provision
Inputs: registry (ReMA compendium s14, workbooks s15, statutes s25 to s30) (fact sheet rows)
Result: 48 seller ID; 11 cash ban; 12 cash cap; 30 hold that can cover copper (11 automatic, 19 on request); 14 infrastructure-specific penalty
Seller ID is nearly universal; cash and hold rules split the states roughly in half.
Limitations: Coding depends on ReMA's summaries, which are current as of dates from 2019 to 2025 per state; 6 states were checked against official statute text.
Jobsite equipment theft trend and recovery
Formulachange = (2016 / 2008) - 1; recovery = recoveries / thefts
Inputs: rows F53, F54, F60 (fact sheet rows)
Result: 13,511 thefts in 2008 to 11,574 in 2016, down 14.3%; 21% recovered in 2016
Equipment theft fell far less than metal theft claims over the same years.
Limitations: NCIC reports only; no NER/NICB report after the 2016 data was found; wire and tools are excluded.
What stolen copper is worth at the benchmark price
FormulaSeptember 2026 price / 2,204.62 lb per metric ton
Inputs: row F34 (fact sheet rows)
Result: $6.56 per pound of refined copper (world benchmark)
Scrap buyers pay less than the refined benchmark, while repairs often cost far more than the metal: DOE found utilities spent just over $1,000 per theft, and AT&T's 2025 figures work out to about $7,885 per incident.
Limitations: Benchmark price, not a scrap price; per-incident costs mix labor, equipment and service losses.
The numbers that matter
- NICB counted 2,887 metal theft insurance claims in the US in 2018, down 4% from 3,017 in 2017; 2018 is the last loss year NICB has published.[1][4]
- US metal theft claims fell from 14,676 in 2011 to 2,887 in 2018, a decline of 80.3% across NICB report vintages.[9][1]
- Copper was named in 95% of the 5,904 US metal theft claims filed for 2017 to 2018, and 41% of those claims were on commercial policies.[1]
- New Jersey (570), Pennsylvania (488), Ohio (410), New York (405) and Illinois (333) filed the most US metal theft claims in 2017 to 2018, 37.4% of the national total.[1]
- Connecticut had the highest metal theft claim rate in 2017 to 2018 at 6.8 claims per 100,000 residents in NICB's state table; the same report also prints 13.8 and 23.0.[1]
- Ohio's metal theft claims fell from 1,485 in 2014 to 208 in 2017, a drop of 86.0%, the steepest among the top five states.[2]
- Monthly US metal theft claims and the IMF global copper price correlated at r = 0.56 over January 2014 to December 2017, matching NICB's own 0.55.[2][13]
- On month-to-month changes the same correlation is only r = 0.11 (2014 to 2017), so the level correlation mostly reflects both series falling together.[2][13]
- US metal theft claims per $1,000 per metric ton of copper price fell from 1,858.6 in 2013 to 442.1 in 2018, a decline of 76.2%.[7][1][13]
- Communications providers reported 5,770 intentional theft and vandalism incidents from June to December 2024, affecting more than 1.5 million US customers; California and Texas accounted for 51%.[19]
- AT&T logged more than 10,400 copper theft incidents in 2025 with about $82 million in losses; more than 7,300 incidents (70.2%) were in California.[20]
- In a 2008 survey of 618 US electric utilities, ESFI counted 18,400 copper theft incidents with $22 million in repair costs, about $1,200 per incident (DOE, 2010).[16]
- 11 states ban cash for copper at any amount and 12 cap cash payments, from $25 in South Carolina to $1,000 in Florida and North Dakota (ReMA, November 2025).[14][15]
- 14 states carry a criminal penalty tied specifically to utility, telecom or critical infrastructure metal, including Texas, Missouri, Indiana, Nevada and Colorado.[14][28][30]
- NCIC logged 11,574 US heavy equipment thefts in 2016, 14.3% fewer than the 13,511 in 2008; only 21% of the 2016 thefts were recovered.[21][23]
In short
- NICB counted 14,676 insured metal theft claims in 2011 and 2,887 in 2018, a fall of 80.3%; 95% of the 2017 to 2018 claims involved copper.
- We found no national claims series after 2018: NICB's latest metal theft release we found is dated October 29, 2019, so current copper theft counts come from utilities, carriers and police.
- Monthly claims and the IMF copper price moved together from 2014 to 2017 (r = 0.56), but month-to-month changes barely line up (r = 0.11), so most of the link is a shared downward trend.
- Claims per $1,000 per metric ton of copper price fell from 1,858.6 in 2013 to 442.1 in 2018, a drop of 76.2%: theft claims fell much faster than the price did.
- The copper price reached $14,473 per metric ton in September 2026, 2.22 times the 2018 average, yet no national claims data exist to show whether insured thefts followed.
- Telecom carriers report the largest current numbers: 5,770 theft and vandalism incidents in seven months of 2024 (NCTA survey) and more than 10,400 AT&T copper theft incidents in 2025.
- Our 50-state ledger of ReMA summaries finds 48 states require a seller ID, 11 ban cash for copper, 30 allow a hold that can cover copper and 14 carry an infrastructure-specific penalty.
- On construction sites, NCIC logged 11,574 heavy equipment thefts in 2016 and only 21% were recovered; there is no national series for stolen building wire.
What people search for
Why do people steal copper wire?
Copper has scrap value and is easy to sell where buyers do not check sellers. NICB found monthly theft claims correlated with the copper price, DOE called price the major factor in utility thefts, and the 2025 NCTA report blames rising copper prices for attacks on poles, towers and construction sites. Thefts also hit fiber lines that contain no copper.
Is copper theft a felony?
It depends on the state, the value and the target. Hawaii makes theft of 1 pound or more of copper a class C felony; Missouri makes stealing telecom or electrical wire a class C felony at any value; Texas makes damaging copper at a critical infrastructure facility a third degree felony. In many other states the grade follows the value, and several count repair costs toward that value. This is not legal advice.
What are the scrap metal laws in my state?
The ledger on this page lists each state's statute, seller ID rule, record retention, hold period, cash rule for copper and any infrastructure penalty. 48 states require a seller ID, 11 ban cash for copper, 12 cap cash and 30 allow a hold that can cover copper. Confirm current text with the state legislature, since laws change often.
How much is stolen copper worth?
The IMF world benchmark for refined copper averaged $14,473 per metric ton in September 2026, about $6.56 per pound; scrap buyers pay less than that. The damage is usually worth more than the metal: DOE found a utility thief typically took a few hundred dollars of copper while repairs cost just over $1,000, and AT&T's 2025 losses work out to about $7,885 per incident.
Common questions
How many copper thefts happen in the US each year?
We found no current national annual count from any agency. The last national series, NICB insurance claims, recorded 2,887 metal theft claims in 2018, 95% of them involving copper in 2017 to 2018. Industry counts are larger: AT&T alone reported more than 10,400 copper theft incidents in 2025.
Is copper theft going up?
Insured claims fell 80.3% from 2011 to 2018, and we found no national count published since. Telecom figures point the other way: providers reported 5,770 incidents in seven months of 2024, and the copper price in September 2026 was 2.22 times its 2018 average.
Which states have the most copper theft?
By insurance claims in 2017 to 2018, New Jersey (570), Pennsylvania (488), Ohio (410), New York (405) and Illinois (333) led. Per resident, Connecticut ranked first at 6.8 claims per 100,000. For telecom incidents in 2024, California and Texas made up 51% of reported incidents.
Does copper theft rise when copper prices rise?
The two moved together from 2014 to 2017 (r = 0.56 on monthly levels), but month-to-month changes barely correlate (r = 0.11), and claims kept falling when prices rose in 2017. State laws passed in the same years are a competing explanation.
What does copper theft cost?
NICB cites a 2007 DOE estimate of about $1 billion a year for US businesses, which we could not verify at the source. Measured figures are narrower: $22 million in repair costs across 618 utilities in 2008, and about $82 million in losses at AT&T in 2025.
Do scrap yards have to check ID?
In 48 states the buyer must record or copy a seller's ID for copper sales. Wyoming accepts an ID or a vehicle plate number, and Massachusetts' copper records require only the seller's name and address, according to ReMA's November 2025 compendium.
Can a scrap yard pay cash for copper?
11 states ban cash for copper at any amount, and 12 cap it, from $25 in South Carolina to $1,000 in Florida and North Dakota. California allows cash for nonferrous metal only after a 3-business-day wait, and Texas requires a state cash transaction card.
How long must scrap yards hold copper before reselling it?
11 states set an automatic hold that can cover copper, from 24 hours in New Mexico to 15 days in Virginia for items bought without papers. Another 19 states require a hold only when police ask, from 48 hours in Pennsylvania to 90 days in California.
How much construction equipment is stolen?
NCIC logged 11,574 heavy equipment thefts in 2016 and recorded recoveries for 21%. Texas had the most with 2,375. Estimates of the annual cost range from $300 million to $1 billion, not counting stolen tools or wire.
Is copper theft dangerous?
Yes. DOE reported that copper wire theft caused 25 of 2,021 large utility outages over five years, and NICB reports note thieves electrocuted while cutting live conductors. Only a licensed electrician or the utility should handle damaged wiring or a vandalized panel; report suspected theft to police and the utility.
Get the data
Every table in this report is available as a CSV under CC BY 4.0. The fact sheet lists each value with its source URL and access date.
- derived_metrics.csv (CSV)
- fact_sheet.csv (CSV)
- 50-state scrap metal law ledger for copper (CSV)
- US metal theft insurance claims by loss year and NICB report vintage, 2011 to 2018 (CSV)
- Top 15 states for metal theft claims, 2017 to 2018, with 2014 to 2017 change (CSV)
- Metal theft claims vs the IMF global copper price, 2011 to 2026 (CSV)
- Utility and telecom copper theft figures by source tier (CSV)
- US heavy equipment thefts reported to NCIC, 2008 to 2016 (CSV)
- How many states use each scrap metal rule for copper (CSV)
Cite this report
The figures to cite first
- US metal theft insurance claims: 2,887 in 2018, down 80.3% from 14,676 in 2011 (NICB).[1][9]
- Claims vs copper price, 2014 to 2017: r = 0.56 on levels, r = 0.11 on monthly changes (NICB dataset, IMF price via FRED).[2][13]
- 11 states ban cash for copper; 48 require seller ID; 14 have an infrastructure-specific penalty (ReMA compendium, Nov. 2025).[14]
Quotable figures
- US metal theft insurance claims fell from 14,676 in 2011 to 2,887 in 2018, a decline of 80.3% (NICB).[9][1]
- The latest NICB metal theft claims release we found is dated October 29, 2019 and covers loss years 2017 and 2018.[4]
- Monthly US metal theft claims and the copper price correlated at r = 0.56 from 2014 to 2017, but only r = 0.11 on month-to-month changes.[2][13]
- Communications providers reported 5,770 theft and vandalism incidents in seven months of 2024, disrupting more than 1.5 million US customers (NCTA).[19]
- AT&T logged more than 10,400 copper theft incidents in 2025, with about $82 million in losses (Light Reading).[20]
- 11 US states ban cash payments for copper scrap and 48 require scrap buyers to record a seller ID (ReMA, November 2025).[14]
- Only 21% of the 11,574 pieces of heavy equipment reported stolen in the US in 2016 were recovered (NER and NICB).[21]
Summary for editors
Copper theft has no current national count. The National Insurance Crime Bureau's claims series, the only national measure, fell from 14,676 metal theft claims in 2011 to 2,887 in 2018 and has not been updated since an October 2019 release. An Electrical Contractors and Wiring analysis finds monthly claims tracked the copper price from 2014 to 2017 (r = 0.56), but month-to-month changes barely line up (r = 0.11), and claims per unit of copper price fell 76.2% from 2013 to 2018 as states tightened scrap laws. Telecom carriers now report the largest numbers: 5,770 incidents in seven months of 2024 and more than 10,400 at AT&T in 2025. A 50-state ledger built from ReMA's November 2025 compendium shows 48 states require seller ID, 11 ban cash for copper, 30 allow holds that can cover copper and 14 carry infrastructure-specific penalties. The copper price in September 2026 was 2.22 times its 2018 average.
Headlines the data supports
- Copper theft claims fell 80% in seven years, then the national count stopped
- The last national count of US copper theft insurance claims covers 2018
- 11 states ban cash for copper scrap; 22 have no cash limit for copper
- AT&T logged more than 10,400 copper thefts in 2025; copper set a monthly price high in September 2026
- Copper prices and theft claims moved together, but scrap laws may explain more
Citation
Electrical Contractors and Wiring. (2026). Copper theft in the US: insurance claims, the copper price link and 50 state scrap metal laws. Retrieved from https://electricalcontractorsandwiring.com/data/copper-theft/
Reuse
Data and tables are licensed CC BY 4.0. Attribution: “Source: Electrical Contractors and Wiring, Copper theft in the US: insurance claims, the copper price link and 50 state scrap metal laws” with a link to this page.
How we built this report
Selection: we used every NICB metal theft release and ForeCAST report we could open (2009 to 2019), the NICB 2019 monthly and state dataset, the IMF global copper price (FRED PCOPPUSDM, monthly, updated 2026-10-22), DOE and FCC documents, the NCTA 2025 industry report, and NER/NICB equipment theft reports. NICB pages block scripts, so most NICB documents were read as Internet Archive copies, labeled in the references.
Claims series: ISO ClaimSearch is a live database and NICB changed its keyword filters between reports, so the same loss year carries different counts in different releases. We used the latest published vintage for each year and list the alternatives in table t1. All counts are insured claims, not incidents.
Correlation: we matched NICB's 48 monthly claim counts for 2014 to 2017 to the monthly IMF price and computed Pearson r on levels, on first differences, with a three-month price lead, and on eight annual points (2011 to 2018). The calculations are in scripts/compute_corr.py and derived_metrics.csv. Correlation is reported without any causal claim.
State law ledger: each state was coded from ReMA's State Metals Theft Statutes compendium (compiled November 11, 2025; per-state summaries current as of 2019 to 2025) and ReMA's payment, hold and statute workbooks. Colorado, Florida, Hawaii, Minnesota, Missouri and West Virginia were checked against official legislature text on 2026-10-27. Statutes amended after a state's ReMA summary date may not be reflected, except Colorado HB26-1101 (2026). The infrastructure penalty column reflects criminal provisions included in the compendium or checked statutes; states may have separate critical infrastructure laws not covered by ReMA.
Conflicts: where one NICB report prints different figures for the same measure (Connecticut's per-capita rate appears as 13.8, 23.0 and 6.8), we used the value reproducible from the published counts and flagged the others. The FCC speech and NCTA report give different start months for the 5,770 incidents; we used NCTA's June to December 2024.
Exclusions: vendor blogs, roundup pages and unsourced figures were excluded, including a widely repeated FBI incident count for 2019 that we could not trace to a primary source. Company figures from AT&T are Tier 3 because the company's own post could not be opened. See excluded.md.
Last updated 2026-10-27. Data and tables are licensed CC BY 4.0. This page is research, not legal advice.
This report presents published data with its limitations. It is not legal, financial or investment advice.
Sources by tier
Tier 1: primary and official sources (26)
- [1] National Insurance Crime Bureau (NICB). Metal Theft Claims from January 1, 2017 to December 31, 2018 (ForeCAST report, public dissemination). 2017 to 2018. Accessed 2026-10-27.
- [2] National Insurance Crime Bureau (NICB). Metal Theft Claims from January 1, 2014 through December 31, 2017 (ForeCAST report) and 2019 release dataset. 2014 to 2017. Accessed 2026-10-27.
- [3] National Insurance Crime Bureau (NICB). Metal Theft Claims from January 1, 2014 through December 31, 2016 (ForeCAST report). 2014 to 2016. Accessed 2026-10-27.
- [4] National Insurance Crime Bureau (NICB). NICB Sees Decline in Metal Thefts (news release, Oct. 29, 2019). 2017 to 2018. Accessed 2026-10-27.
- [5] National Insurance Crime Bureau (NICB). Metal Thefts Continue Downward Trend (news release, April 4, 2019). 2014 to 2017. Accessed 2026-10-27.
- [6] National Insurance Crime Bureau (NICB). NICB Reports Steep Drop in Metal Theft Claims (news release, Nov. 21, 2017). 2014 to 2016. Accessed 2026-10-27.
- [7] National Insurance Crime Bureau (NICB). Insured Metal Theft Claims Take Dramatic Dive (NICB blog of the 2016 release). 2013 to 2015. Accessed 2026-10-27.
- [8] National Insurance Crime Bureau (NICB). Metal Theft Claims Down 8% Since 2012 (NICB blog of the 2015 release). 2012 to 2014. Accessed 2026-10-27.
- [9] National Insurance Crime Bureau (NICB). Insured Metal Theft Claims See Three-Year Decline (news release, May 8, 2014). 2011 to 2013. Accessed 2026-10-27.
- [10] National Insurance Crime Bureau (NICB). 2013 Metal Theft Report (news release, May 1, 2013). 2010 to 2012. Accessed 2026-10-27.
- [11] National Insurance Crime Bureau (NICB). Metal Theft Report: NICB Reports Metal Thefts Increase 81 Percent Since 2008 (news release, March 8, 2012). 2009 to 2011. Accessed 2026-10-27.
- [12] National Insurance Crime Bureau (NICB). Base and Semi-Precious Metal Theft Claim Report (news release, March 3, 2009). Jan 2006 to Nov 2008. Accessed 2026-10-27.
- [13] International Monetary Fund via FRED, Federal Reserve Bank of St. Louis. Global price of Copper (PCOPPUSDM), monthly, U.S. dollars per metric ton. Jan 2011 to Sep 2026 (updated 2026-10-22). Accessed 2026-10-27.
- [16] U.S. Department of Energy, Office of Electricity Delivery and Energy Reliability. An Updated Assessment of Copper Wire Thefts from Electric Utilities (October 2010). 2000 to Aug 2010. Accessed 2026-10-27.
- [17] U.S. Department of Energy, Office of Inspector General. Impact of Copper Thefts on the Department of Energy (OIG Case No. I11IG002, Aug. 17, 2011). 2006 to 2011. Accessed 2026-10-27.
- [18] Federal Communications Commission. Remarks of Commissioner Olivia B. Trusty, Copper Theft Crisis summit (Oct. 7, 2025). 2024 to 2025. Accessed 2026-10-27.
- [21] National Equipment Register (Verisk) and National Insurance Crime Bureau. 2016 Equipment Theft Report. 2016. Accessed 2026-10-27.
- [22] National Insurance Crime Bureau (NICB). NICB releases 2014 heavy equipment theft report (news release, Oct. 1, 2015). 2013 to 2014. Accessed 2026-10-27.
- [23] National Insurance Crime Bureau (NICB). NICB releases 2012 heavy equipment theft report (news release, Oct. 10, 2013). 2008, 2011 to 2012. Accessed 2026-10-27.
- [24] National Insurance Crime Bureau (NICB). NER and NICB release 2010 heavy-equipment theft report (news release, July 21, 2011). 2010. Accessed 2026-10-27.
- [25] Florida Legislature. Florida Statutes 538.235 Method of payment and 538.26 Certain acts and practices prohibited (2026 Florida Statutes). 2026. Accessed 2026-10-27.
- [26] Minnesota Office of the Revisor of Statutes. Minnesota Statutes 325E.21 Scrap metal dealers; records, reports, and registration. current. Accessed 2026-10-27.
- [27] Hawaii State Legislature. Hawaii Revised Statutes 708-835.7 Theft of copper. current. Accessed 2026-10-27.
- [28] Missouri Revisor of Statutes. Revised Statutes of Missouri 570.030 Stealing, penalties (effective Aug. 28, 2025). effective 2025-08-28. Accessed 2026-10-27.
- [29] West Virginia Legislature. West Virginia Code 61-3-49b Disruption of communications and utilities services. current. Accessed 2026-10-27.
- [30] Colorado General Assembly. HB26-1101 Criminal Offenses Related to Critical Infrastructure Metals (became law; signed 05/07/2026). 2026 regular session. Accessed 2026-10-27.
Tier 2: trade bodies, market research, company data (3)
- [14] Recycled Materials Association (ReMA, formerly ISRI). State Metals Theft Statutes (compendium, compiled as of November 11, 2025). State laws, per-state summaries current as of 2019 to 2025. Accessed 2026-10-27.
- [15] Recycled Materials Association (ReMA). State Metals Theft Law Database: common reports (payment, hold, statute reference workbooks). State laws. Accessed 2026-10-27.
- [19] NCTA, The Internet and Television Association, with telecom industry partners. Protecting the Nation's Critical Communications Infrastructure from Theft and Vandalism (Spring 2025 update) and April 9, 2025 release. June to December 2024. Accessed 2026-10-27.
Tier 3: journalism and expert commentary (1)
- [20] Light Reading (Informa). AT&T averaged 200 copper theft cases per week in 2025 (Light Reading, April 6, 2026), reporting an AT&T Global Security blog post. 2025. Accessed 2026-10-27.