Data Center Electrician Pay, Jobs and Where the Work Is Growing
- Data
- BLS OEWS May 2025; BLS QCEW 2025 annual averages; Census Value of Construction Put in Place (September 2026 data)
- Period
- OEWS May 2023 to May 2025; QCEW 2021 to 2025 and Q1 2026; Census January 2014 to September 2026
- Release used
- 2026-11-02
- Next release
- 2026-12-01 (Census construction spending, October 2026 data)
- Geography
- United States, 50 states and DC
- Sources
- 34 (29 official)
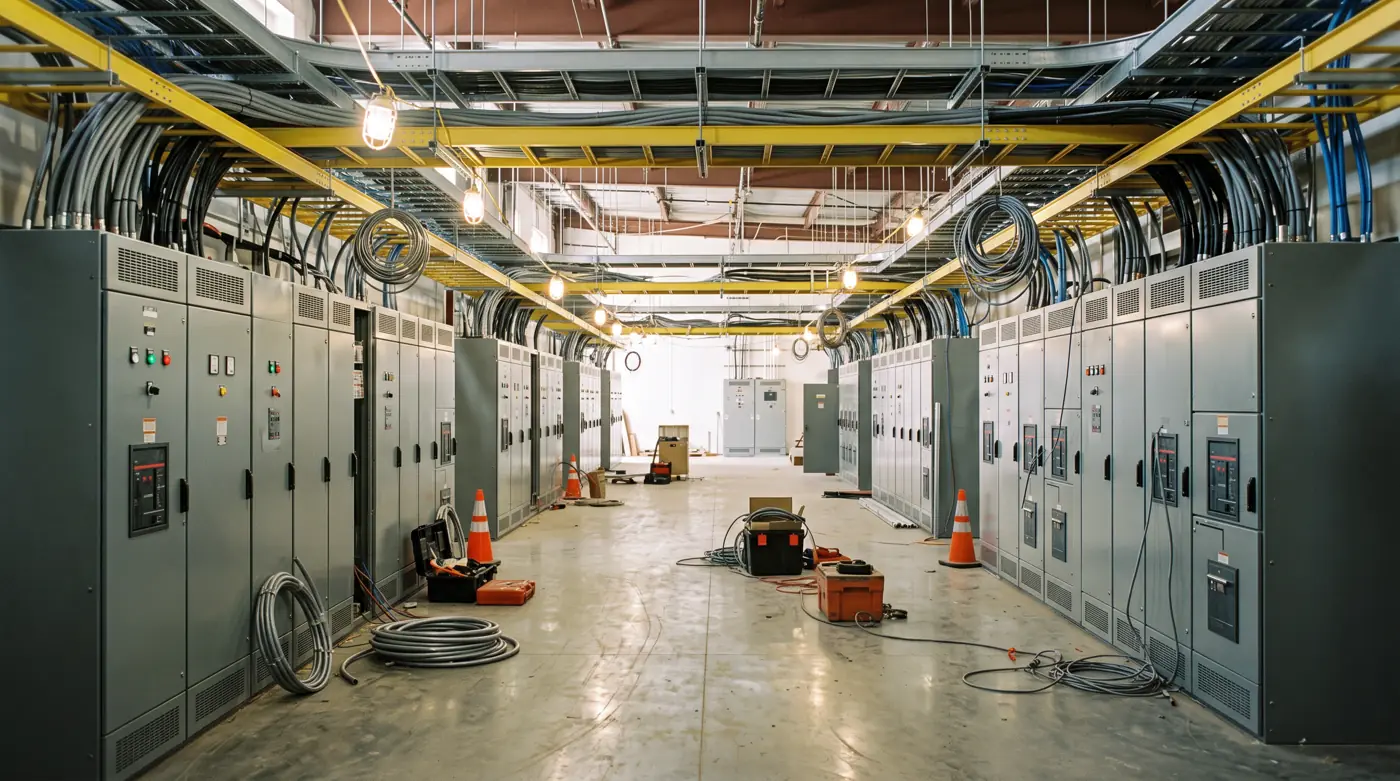
A data center electrician is almost always a contractor employee. BLS counted about 100 electricians on data processing and hosting payrolls in May 2024, against 541,390 at electrical contractors in May 2025, where the median wage was $61,570. Census data center construction spending reached $67.6 billion in the 12 months to September 2026, 3.87 times the level three years earlier.
Data center electrician pay follows the electrical contractor wage
Federal wage data cannot isolate electricians working on data center jobs, because the employer, not the job site, sets the industry code. Most of these electricians work for electrical contractors, so the contractor wage is the closest official benchmark; the small group on data processing payrolls earned more when BLS last published it.
The Occupational Employment and Wage Statistics (OEWS) survey assigns each worker to the industry of the employer. An electrician wiring a hyperscale data hall for an electrical contractor is counted in NAICS 238210, not in NAICS 518200, the industry of the data center operator. In May 2025, electrical contractors employed 541,390 electricians, 71.5% of the 757,220 wage and salary electricians in the U.S. (BLS OEWS industry file).
| Industry (NAICS) | Reference period | Electricians employed | Mean annual wage | Median annual wage |
|---|---|---|---|---|
| All industries (cross-industry) | May 2025 | 757,220 | $71,490 | $63,190 |
| Electrical contractors and other wiring installation contractors (238210) | May 2025 | 541,390 | $69,990 | $61,570 |
| Nonresidential building construction (236200) | May 2025 | 14,670 | $71,360 | $64,010 |
| Electric power generation, transmission and distribution (221100) | May 2025 | 7,950 | $102,220 | $106,640 |
| Information sector (51), all industries in the sector | May 2025 | 1,180 | $98,000 | $97,780 |
| Computing infrastructure, data processing, web hosting (518200): electricians | May 2025 | Not published | Not published | Not published |
| 518200: construction and extraction occupations group | May 2025 | Not available (**) | $84,670 | $70,100 |
| 518200: electricians | May 2024 | 100 | Not available (*) | Not available (*) |
| 518200: electricians | May 2023 | 90 | $73,550 | $77,630 |
Not published: BLS released no electrician row for NAICS 518200 in May 2025. * = wage not available; ** = employment not available (BLS footnotes). OEWS excludes the self-employed.
Source: [1][2][4][5] U.S. Bureau of Labor Statistics; U.S. Bureau of Labor Statistics; U.S. Bureau of Labor Statistics; U.S. Bureau of Labor Statistics
OEWS May 2025 unless marked; 518200 = computing infrastructure, data processing and hosting
Source: U.S. Bureau of Labor Statistics, OEWS national industry-specific estimates, May 2025 and May 2023
Electricians at electrical contractors earned a median of $61,570 in May 2025, 2.6% below the all-industry electrician median of $63,190. The 90th percentile at electrical contractors was $108,780 (BLS OEWS). Base wages are only part of data center pay: the BLS Occupational Outlook Handbook notes that overtime is common for electricians (BLS OOH), and OEWS wages are straight-time pay that exclude overtime pay and shift differentials (BLS OEWS technical notes).
For the small group employed directly by data processing and hosting firms, the latest published median was $77,630 in May 2023, 26.0% above the all-electrician median of $61,590 that year. The May 2025 file shows the construction and extraction group at those firms with a mean of $84,670, 18.4% above the all-electrician mean, and a median of $70,100 (BLS OEWS May 2023, May 2025).
NAICS 518200 and 518210: Computing Infrastructure Providers, Data Processing, Web Hosting, and Related Services. BLS describes the group as establishments that provide the infrastructure for hosting and/or data processing services (BLS Industries at a Glance). OEWS publishes it at the 4-digit level (518200); QCEW publishes the 6-digit industry (518210).
State pay differs more than industry pay. Among the five states with the most data processing and hosting jobs, the electrician median in May 2025 was $78,750 in New York and $76,160 in California, above the U.S. median of $63,190, and $58,570 in Texas, $58,320 in Georgia and $57,250 in Florida, below it (BLS OEWS state file). Full state medians are on the electrician salary by state page; union inside wireman rates are in the IBEW pay scale report.
All industries, OEWS May 2025
Source: U.S. Bureau of Labor Statistics, OEWS state estimates, May 2025
Data center construction spending reached a $96.5 billion annual rate
The Census Bureau data center series is the only official national measure of how much data center building work is underway. It has grown every calendar year since it began in January 2014 and roughly quadrupled in three years.
Census counts as a data center any building that contains the hardware needed for storing, processing and transmitting digital information; the servers and racks themselves are excluded as equipment, while the building and its mechanical and electrical installations, including emergency backup power, count as construction (Census definitions).
In the 12 months from October 2025 to September 2026, private data center construction spending totaled $67.6 billion, 3.87 times the $17.5 billion of October 2022 to September 2023 (Census monthly series). The seasonally adjusted annual rate for September 2026 was $96.5 billion, up 90.3% from $50.7 billion in September 2025 (Census SAAR series).
Sum of monthly values, not seasonally adjusted, current dollars
Source: U.S. Census Bureau, Value of Construction Put in Place (release of November 2, 2026)
| Year | Data center construction spending ($ millions, sum of monthly values) | Months in sum | Share of private nonresidential construction (%) |
|---|---|---|---|
| 2014 | 1,797 | 12 | 0.5 |
| 2015 | 2,745 | 12 | 0.7 |
| 2016 | 4,121 | 12 | 0.9 |
| 2017 | 4,667 | 12 | 1.1 |
| 2018 | 6,933 | 12 | 1.5 |
| 2019 | 8,483 | 12 | 1.7 |
| 2020 | 9,231 | 12 | 1.9 |
| 2021 | 9,949 | 12 | 2.0 |
| 2022 | 12,583 | 12 | 2.1 |
| 2023 | 19,995 | 12 | 2.7 |
| 2024 | 34,797 | 12 | 4.4 |
| 2025 | 49,737 | 12 | 6.3 |
| 2026 (January to September) | 54,207 | 9 | 9.5 |
Sums of monthly not seasonally adjusted values in current dollars. 2026 covers January to September; recent months are preliminary or revised. Release of 2026-11-02.
Source: [16] U.S. Census Bureau
Data centers took 8.9% of private nonresidential construction spending in the latest 12 months, against 2.4% three years earlier. Total U.S. construction spending was $2,186.1 billion at a seasonally adjusted annual rate in September 2026 (Census release of November 2, 2026). Figures are in current dollars and are not adjusted for construction cost inflation.
Washington, Virginia and Georgia have the highest data processing job concentration
No federal series counts data center construction by state. QCEW employment in NAICS 518210 shows where hosting and data processing firms employ staff, which is a partial guide to where facilities operate; it also includes software and cloud staff in headquarters states.
NAICS 518210 private employment was 483,954 in 2025, or 3.63 jobs per 1,000 private jobs (BLS QCEW 2025). California led on count with 81,824 jobs, but its average annual pay of $327,171 points to headquarters and engineering staff rather than facility crews. Measured per 1,000 private jobs, Washington (7.76), Virginia (5.92), Georgia (5.85) and Missouri (5.81) rank highest.
NAICS 518210 private employment, annual average; AK, ND, SD and WY not disclosed
Source: U.S. Bureau of Labor Statistics, Quarterly Census of Employment and Wages, 2025 annual averages
NAICS 518210 private employment, annual average
Source: U.S. Bureau of Labor Statistics, Quarterly Census of Employment and Wages, 2025 annual averages
Show all 52 rows
| Rank | State | NAICS 518210 private employment, 2025 | Per 1,000 private jobs | Location quotient | Average annual pay | Employment change 2021 to 2025 (%) |
|---|---|---|---|---|---|---|
| 1 | California | 81,824 | 5.27 | 1.45 | $327,171 | 44.5 |
| 2 | Texas | 48,266 | 4.00 | 1.10 | $179,488 | 18.1 |
| 3 | New York | 28,710 | 3.43 | 0.94 | $239,074 | 34.6 |
| 4 | Florida | 28,540 | 3.24 | 0.93 | $160,238 | 24.3 |
| 5 | Georgia | 24,620 | 5.85 | 1.62 | $171,830 | 27.6 |
| 6 | Washington | 23,335 | 7.76 | 2.08 | $267,744 | 54.1 |
| 7 | Virginia | 20,163 | 5.92 | 1.56 | $182,092 | 34.2 |
| 8 | Illinois | 16,892 | 3.22 | 0.90 | $208,615 | 30.7 |
| 9 | New Jersey | 16,171 | 4.36 | 1.22 | $216,341 | 39.2 |
| 10 | Missouri | 14,429 | 5.81 | 1.60 | $155,621 | 15.9 |
| 11 | Ohio | 13,195 | 2.75 | 0.77 | $134,884 | 46.0 |
| 12 | Colorado | 13,164 | 5.41 | 1.46 | $196,914 | -14.3 |
| 13 | Pennsylvania | 13,152 | 2.45 | 0.70 | $148,063 | 7.8 |
| 14 | North Carolina | 12,554 | 2.97 | 0.82 | $156,003 | 21.4 |
| 15 | Arizona | 10,723 | 3.79 | 1.07 | $149,458 | -6.0 |
| 16 | Michigan | 10,066 | 2.64 | 0.73 | $138,764 | 22.4 |
| 17 | Massachusetts | 9,960 | 3.13 | 0.88 | $292,029 | 11.1 |
| 18 | Wisconsin | 8,222 | 3.21 | 0.90 | $130,255 | -2.2 |
| 19 | Utah | 8,164 | 5.54 | 1.51 | $159,253 | 30.4 |
| 20 | Tennessee | 7,806 | 2.75 | 0.77 | $169,132 | 13.1 |
| 21 | Oregon | 7,644 | 4.52 | 1.24 | $212,423 | 10.5 |
| 22 | Minnesota | 7,258 | 2.85 | 0.79 | $166,962 | 17.5 |
| 23 | Maryland | 5,551 | 2.49 | 0.65 | $207,190 | 44.0 |
| 24 | Connecticut | 4,475 | 3.05 | 0.85 | $203,642 | 40.2 |
| 25 | South Carolina | 4,201 | 2.16 | 0.58 | $134,980 | 7.3 |
| 26 | Indiana | 4,188 | 1.50 | 0.42 | $109,886 | 41.3 |
| 27 | Arkansas | 3,961 | 3.58 | 0.98 | $118,347 | 3.4 |
| 28 | Alabama | 3,774 | 2.19 | 0.57 | $110,769 | 60.9 |
| 29 | Kentucky | 3,642 | 2.15 | 0.59 | $110,475 | -18.4 |
| 30 | Iowa | 3,550 | 2.71 | 0.73 | $125,759 | 4.0 |
| 31 | Nevada | 3,171 | 2.27 | 0.65 | $187,512 | 17.1 |
| 32 | Louisiana | 3,166 | 1.95 | 0.53 | $89,486 | 9.5 |
| 33 | Kansas | 2,389 | 2.02 | 0.54 | $137,232 | 10.1 |
| 34 | Nebraska | 2,196 | 2.57 | 0.69 | $128,649 | -8.0 |
| 35 | New Hampshire | 2,070 | 3.42 | 0.97 | $158,851 | 54.7 |
| 36 | District of Columbia | 1,653 | 3.21 | 0.72 | $258,622 | -0.8 |
| 37 | Oklahoma | 1,652 | 1.21 | 0.31 | $102,501 | 2.5 |
| 38 | Mississippi | 1,312 | 1.39 | 0.36 | $82,376 | 37.1 |
| 39 | Idaho | 1,309 | 1.75 | 0.48 | $160,177 | 75.7 |
| 40 | West Virginia | 1,244 | 2.22 | 0.58 | $89,721 | 8.1 |
| 41 | New Mexico | 997 | 1.44 | 0.37 | $143,827 | 43.5 |
| 42 | Maine | 805 | 1.46 | 0.40 | $142,920 | 8.8 |
| 43 | Rhode Island | 691 | 1.58 | 0.45 | $196,406 | 15.4 |
| 44 | Hawaii | 528 | 1.01 | 0.26 | $189,058 | 17.6 |
| 45 | Delaware | 516 | 1.25 | 0.34 | $153,755 | 14.9 |
| 46 | Montana | 506 | 1.18 | 0.32 | $339,905 | 6.8 |
| 47 | Vermont | 496 | 1.95 | 0.52 | $158,009 | 30.5 |
| Alaska | Not disclosed | Not disclosed | Not disclosed | Not disclosed | Not disclosed | |
| North Dakota | Not disclosed | Not disclosed | Not disclosed | Not disclosed | Not disclosed | |
| South Dakota | Not disclosed | Not disclosed | Not disclosed | Not disclosed | Not disclosed | |
| Wyoming | Not disclosed | Not disclosed | Not disclosed | Not disclosed | Not disclosed | |
| United States | 483,954 | 3.63 | 1.00 | $205,865 | 24.5 |
Private ownership, annual averages (preliminary). Per 1,000 private jobs uses QCEW all-industry private employment. Colorado data were affected by a QCEW publication suspension in 2024 to 2025.
Source: [9][10][13] U.S. Bureau of Labor Statistics; U.S. Bureau of Labor Statistics; U.S. Bureau of Labor Statistics
Four states, Alaska, North Dakota, South Dakota and Wyoming, had 518210 employment withheld because state data are published only if disclosure restrictions are met (BLS QCEW overview). Colorado shows a 14.3% decline from 2021 to 2025, but QCEW suspended Colorado industry data from November 2024 to February 2025 over data quality concerns, so that change should be read with caution (BLS OEWS technical notes).
Few electricians work for data center operators; contractor payrolls grew 15.9%
Data center operators employ very few electricians directly. The jobs show up at electrical contractors, whose employment grew faster than the industry base would suggest, but not fastest in the states with the most hosting jobs.
BLS estimated 90 electricians at NAICS 518200 firms in May 2023 and 100 in May 2024, out of 482,080 and 484,990 total jobs in the industry. That is 0.013% of all electricians in May 2023. Installation, maintenance and repair occupations at the same firms numbered 2,370 in May 2025, including 1,210 general maintenance and repair workers (BLS OEWS). Facility technician roles advertised as data center electrician jobs may be coded to those occupations.
| Occupation group in NAICS 518200 | Employment May 2023 | Employment May 2024 | Employment May 2025 | Median annual wage, latest published |
|---|---|---|---|---|
| All occupations | 482,080 | 484,990 | 485,550 | $107,510 (May 2025) |
| Electricians (47-2111) | 90 | 100 | Not published | $77,630 (May 2023) |
| Construction and extraction occupations (47-0000) | 90 | 110 | Not available (**) | $70,100 (May 2025) |
| Installation, maintenance and repair occupations (49-0000) | 1,820 | 2,650 | 2,370 | $76,860 (May 2025) |
| Maintenance and repair workers, general (49-9071) | 1,210 | $68,760 (May 2025) | ||
| Electrical engineers (17-2071) | 370 | $124,420 (May 2025) |
Blank = not extracted for that year. Not published / not available follow BLS footnotes.
Source: [1][4][5] U.S. Bureau of Labor Statistics; U.S. Bureau of Labor Statistics; U.S. Bureau of Labor Statistics
Electrical contractor (NAICS 23821) private employment, all occupations, rose 15.9% from 968,864 in 2021 to 1,123,060 in 2025 (BLS QCEW). Among the top 10 data processing states, Texas (27.1%), Virginia (26.7%) and Georgia (23.8%) grew fastest, while New York (1.2%) and California (4.1%) grew least. The top 10 combined grew 13.3%, below the 18.5% in the remaining states, so the data do not show contractor hiring concentrated in the states with the largest hosting payrolls.
NAICS 23821 private employment, percent change in annual average
Source: U.S. Bureau of Labor Statistics, Quarterly Census of Employment and Wages, 2021 and 2025 annual averages
| State | NAICS 518210 rank, 2025 | Electrical contractor (23821) employment, 2021 | Electrical contractor employment, 2025 | Change 2021 to 2025 (%) | Electrician median wage, May 2025 | Median vs U.S. electrician median (%) |
|---|---|---|---|---|---|---|
| California | 1 | 117,453 | 122,326 | 4.1 | $76,160 | 20.5 |
| Texas | 2 | 90,452 | 114,972 | 27.1 | $58,570 | -7.3 |
| New York | 3 | 57,022 | 57,678 | 1.2 | $78,750 | 24.6 |
| Florida | 4 | 67,760 | 78,618 | 16.0 | $57,250 | -9.4 |
| Georgia | 5 | 29,552 | 36,586 | 23.8 | $58,320 | -7.7 |
| Washington | 6 | 24,244 | 25,436 | 4.9 | $95,220 | 50.7 |
| Virginia | 7 | 29,436 | 37,300 | 26.7 | $62,900 | -0.5 |
| Illinois | 8 | 27,285 | 30,002 | 10.0 | $99,560 | 57.6 |
| New Jersey | 9 | 23,310 | 25,405 | 9.0 | $77,250 | 22.3 |
| Missouri | 10 | 15,731 | 18,298 | 16.3 | $65,410 | 3.5 |
| Top 10 combined | 482,245 | 546,621 | 13.3 | |||
| Other 41 states and DC | 486,620 | 576,436 | 18.5 | |||
| United States | 968,864 | 1,123,060 | 15.9 | $63,190 | 0.0 |
Top 10 ranked by NAICS 518210 private employment in 2025. Electrical contractor employment covers all occupations at NAICS 23821 firms, private ownership. Wages are all-industry state medians for electricians; the full state table lives on the electrician salary by state page.
Source: [9][11][12][3] U.S. Bureau of Labor Statistics; U.S. Bureau of Labor Statistics; U.S. Bureau of Labor Statistics; U.S. Bureau of Labor Statistics
National electrician demand and openings are covered in the electrician shortage report; establishment counts are in electrical contractor counts by state.
Credentials the work asks for: license, apprenticeship, OSHA training and NFPA 70E
Public sources set a common floor for data center electrical work: a state license, an apprenticeship path, OSHA-required safety training and the NFPA 70E workplace safety standard that employers use for energized-work programs.
- Licensing: most states require electricians to be licensed, and most electricians learn through an apprenticeship (BLS OOH). State requirements are in the electrical license lookup; training routes are in how to become an electrician and electrician apprenticeship data.
- OSHA training: 29 CFR 1910.332 requires employees to be trained in the safety-related work practices that pertain to their job assignments (OSHA 1910.332).
- Deenergized work as the default: 29 CFR 1910.333 requires live parts to be deenergized before work unless the employer can show that deenergizing adds hazards or is infeasible (OSHA 1910.333). On construction sites, 29 CFR 1926.416 requires protection by deenergizing and grounding or by guarding (OSHA 1926.416).
- NFPA 70E, Standard for Electrical Safety in the Workplace: the current edition is 2027 and the next is scheduled for 2030 (NFPA).
- Joint union and contractor training: the electrical training ALLIANCE is the training body of the IBEW and NECA and delivers apprenticeship through local JATC training centers (electrical training ALLIANCE). BLS notes that some electricians start out at a technical school (BLS OOH).
Project labor agreements appear in Illinois law and in few county records
Most data center labor terms are private contracts. The public record checked for this report contains one statewide project labor agreement requirement, in Illinois, while three county agreements from Kentucky, Arizona and South Carolina name no project labor agreement.
The Illinois Data Center Investment Program requires a qualifying data center owner or operator to require its contractor to enter into a project labor agreement approved by the Department of Commerce and Economic Opportunity. Through 2025-12-31 the program had 34 approved projects, $10,665,815,092 in investment commitments, an average of $313.7 million per project, and 731 committed jobs; 7 agreements were signed in 2025. The report states that the program pause took effect July 1, 2026 (Illinois DCEO 2025 annual report).
| Public record | Jurisdiction | Record date | Labor term in the record | Workforce figures in the record |
|---|---|---|---|---|
| Data Center Investment Program, 2025 Annual Report (20 ILCS 605/605-1025) | State of Illinois (DCEO) | 2025 report, data to 2025-12-31 | Owner or operator must require its contractor to enter into a project labor agreement approved by the Department | 34 approved projects; $10,665,815,092 investment commitments; 731 committed jobs |
| Summary: Development and Community Revenue Agreement (Crisham LLC) | Mason County, Kentucky | 2026-10-06 | No project labor agreement named; company and county to develop a resident hiring plan | 2,000 construction workers estimated, up to 4,000 at peak; 400 full-time jobs at full build-out |
| Binding Memorandum of Agreement, Project Blue (Humphrey's Peak Properties LLC) | Pima County, Arizona | 2025-12-16 board meeting | No project labor agreement named in the MOA text | 3,000-plus direct construction jobs projected; 180 permanent jobs |
| Draft development agreement ordinance (Numara LLC, Valara Holdings LLC) | Spartanburg County, South Carolina | 2026 draft | No project labor agreement named | $2,756,660,000 investment; 27 full-time jobs target |
Records opened 2026-11-05. Pima County and Spartanburg County documents are copies hosted by third parties; Spartanburg is an unsigned draft. Workforce figures are developer or consultant projections.
Source: [30][31][32][33] Illinois Department of Commerce and Economic Opportunity; Mason County, Kentucky; Pima County, Arizona (document copy); Spartanburg County, South Carolina (document copy)
County records show the construction labor scale that local governments are told to expect. Pima County's binding memorandum of agreement for Project Blue cites 3,000-plus direct construction jobs against 180 permanent jobs, 16.7 construction jobs per permanent job. Mason County's summary estimates up to 4,000 workers at peak against 400 full-time jobs at full build-out. Neither record names a project labor agreement. Union statements about agreements on specific projects were not counted because they are not state or county records.
What the numbers mean for electrical contractors
Construction spending on data centers is rising much faster than either contractor employment or the official count of electricians at data center operators, which points to longer hours and travel rather than a separate, measurable data center workforce.
Data center construction spending in the latest 12 months was 3.87 times its level three years earlier, while electrical contractor employment grew 15.9% from 2021 to 2025. The IBEW's own publication states that between 45% and 70% of a data center construction budget goes to the electrical subcontractor (The Electrical Worker, archived); that range is a union estimate and has not been verified against cost data.
For bidding and staffing, the official benchmark wage is the electrical contractor median of $61,570 in May 2025 and the state median where the job sits. Equipment lead times also shape schedules: see the transformer shortage report. Electricity demand behind the build-out is covered in the data center power consumption report.
How we ranked the states
Data processing payroll wage premium for electricians (May 2023)
Formula77,630 / 61,590 - 1
Inputs: rows 16, 18 (fact sheet rows)
Result: 26.0%
The few electricians employed directly by data processing and hosting firms earned a median 26.0% above all electricians in the last year BLS published the cell.
Limitations: 90 workers; May 2023 only; BLS did not publish the cell in May 2025.
Data center construction spending, latest 12 months vs three years earlier
Formula67,594 / 17,451
Inputs: rows 45, 46 (fact sheet rows)
Result: 3.87 times (287.3% increase)
Data center building work roughly quadrupled in three years and rose from 2.4% to 8.9% of private nonresidential construction.
Limitations: Current dollars; recent months preliminary; national only.
Electrical contractor employment growth, top 10 data processing states vs rest
Formulasum 2025 / sum 2021 - 1 for each group
Inputs: table t4 (fact sheet rows)
Result: 13.3% vs 18.5%
Contractor employment did not grow faster in the states with the largest hosting payrolls; Texas, Virginia and Georgia grew fast, but California and New York grew slowly.
Limitations: 518210 employment measures where firms employ staff, not where data centers are built; contractor employment covers all project types.
Electrician median wage in the five largest data processing states vs U.S.
Formulastate median / 63,190 - 1
Inputs: rows 3, 80 to 84 (fact sheet rows)
Result: New York 24.6%, California 20.5%, Texas -7.3%, Georgia -7.7%, Florida -9.4%
Location changes the official benchmark more than the data center label does.
Limitations: All-industry state medians; not specific to data center work.
Construction jobs per permanent job in a county data center agreement
Formula3,000 / 180
Inputs: rows 106, 107 (fact sheet rows)
Result: 16.7
Data center employment is front-loaded in construction, which is where electricians are hired.
Limitations: Projections in a county memorandum; one project.
State by state
- U.S. private data center construction spending totaled $67.6 billion from October 2025 to September 2026, compared with $17.5 billion from October 2022 to September 2023, a 287.3% increase (Census, not seasonally adjusted).[16]
- The seasonally adjusted annual rate of private data center construction was $96.5 billion in September 2026, compared with $21.3 billion in September 2023 and $1.6 billion in January 2014, the first month of the series (Census).[17]
- Data center construction spending for January to September 2026 was $54.2 billion, 49.1% above the $36.4 billion spent in January to September 2025 (Census).[16]
- Calendar 2025 data center construction spending of $49.7 billion was 27.7 times the 2014 total of $1.8 billion, in current dollars (Census).[16]
- In September 2026, data centers accounted for 12.2% of the seasonally adjusted annual rate of U.S. private nonresidential construction (derived from Census).[17]
- BLS estimated 100 electricians employed by NAICS 518200 computing infrastructure, data processing and web hosting firms in May 2024 and 90 in May 2023; the May 2025 release published no estimate for that cell.[4][5][1]
- Electricians at NAICS 518200 firms earned a median of $77,630 and a mean of $73,550 in May 2023, the latest year BLS published those wages.[5]
- In May 2025, the construction and extraction occupation group at NAICS 518200 firms had a mean wage of $84,670 and a median of $70,100, while employment for the group was not released (BLS OEWS).[1]
- Electricians at electrical contractors (NAICS 238210) earned a median of $61,570 and a mean of $69,990 in May 2025, with a 10th to 90th percentile range of $39,560 to $108,780 (BLS OEWS).[1]
- NAICS 518210 data processing and hosting firms employed 483,954 private workers in 2025, up 24.5% from 388,805 in 2021 (BLS QCEW).[9][10]
- California (81,824), Texas (48,266), New York (28,710), Florida (28,540) and Georgia (24,620) had the most NAICS 518210 private jobs in 2025; the top 10 states held 62.6% of the national total (BLS QCEW).[9]
- Washington had the highest concentration of NAICS 518210 jobs in 2025, 7.76 per 1,000 private jobs, against 3.63 nationally (derived from BLS QCEW).[9][13]
- Electrical contractor (NAICS 23821) private employment rose from 968,864 in 2021 to 1,123,060 in 2025, a 15.9% increase (BLS QCEW).[11][12]
- In the top 10 data processing states combined, electrical contractor employment grew 13.3% from 2021 to 2025, slower than the 18.5% in the other 41 states and DC (derived from BLS QCEW).[9][11][12]
- The Illinois Data Center Investment Program reported 34 approved projects with $10,665,815,092 in investment commitments through 2025-12-31, each subject to a state-approved project labor agreement requirement.[30]
In short
- Private data center construction spending in the U.S. ran at a seasonally adjusted annual rate of $96.5 billion in September 2026, up 90.3% from September 2025 (Census).
- Data centers took 8.9% of private nonresidential construction spending in the 12 months to September 2026, up from 2.4% in the same months of 2022 to 2023 (derived from Census).
- Data processing and hosting firms (NAICS 518200) employed about 100 electricians in May 2024, and BLS published no electrician estimate for the industry in May 2025.
- Electrical contractors (NAICS 238210) employed 541,390 electricians in May 2025, 71.5% of all wage and salary electricians, at a median wage of $61,570 (BLS OEWS).
- The last published median wage for electricians on data processing payrolls was $77,630 in May 2023, 26.0% above the all-electrician median of $61,590 that year.
- Electrical contractor employment grew 15.9% nationally from 2021 to 2025, and 27.1% in Texas, 26.7% in Virginia and 23.8% in Georgia (BLS QCEW).
- Illinois requires a project labor agreement approved by the state commerce department for data centers in its tax incentive program, which had 34 approved projects through 2025.
What people search for
How much do data center electricians make?
BLS does not publish a wage for data center electricians as such. Electricians at electrical contractors, who do most data center electrical work, earned a median of $61,570 in May 2025. Electricians employed directly by data processing firms earned a median of $77,630 in May 2023, the latest year published. OEWS wages exclude overtime pay and shift differentials.
Is data center electrician a good job?
The official data show rising demand: private data center construction spending reached $67.6 billion in the 12 months to September 2026, 3.87 times the level three years earlier. Pay depends mostly on location and employer; the electrician median ranged from $57,250 in Florida to $78,750 in New York among the five largest data processing states in May 2025.
What certifications do data center electricians need?
A state electrician license is required in most states, and most electricians train through an apprenticeship (BLS). Employers must provide OSHA safety-related work practice training under 29 CFR 1910.332, and many follow NFPA 70E, whose current edition is 2027.
Where are data center electrician jobs?
No federal series counts data center construction by state. By NAICS 518210 employment, California, Texas, New York, Florida and Georgia led in 2025, and Washington had the highest concentration at 7.76 jobs per 1,000 private jobs. Electrical contractor employment grew 27.1% in Texas and 26.7% in Virginia from 2021 to 2025.
Common questions
How many electricians work for data center companies?
BLS estimated 100 electricians on the payrolls of NAICS 518200 data processing and hosting firms in May 2024 and 90 in May 2023. The May 2025 release published no estimate for that industry.
Who employs most data center electricians?
Electrical contractors. NAICS 238210 employed 541,390 electricians in May 2025, 71.5% of all wage and salary electricians, while data processing and hosting firms employed about 100 in May 2024.
What is the median wage for electricians at electrical contractors?
$61,570 a year in May 2025, with a mean of $69,990 and a 90th percentile of $108,780 (BLS OEWS).
How much is spent on data center construction in the U.S.?
Census reported a seasonally adjusted annual rate of $96.5 billion for private data center construction in September 2026, and $67.6 billion in actual spending from October 2025 to September 2026.
How fast is data center construction growing?
Spending in the latest 12 months was 3.87 times the same months three years earlier, and the September 2026 annual rate was 90.3% above September 2025 (Census).
What share of construction is data centers?
Data centers were 8.9% of private nonresidential construction spending from October 2025 to September 2026 and 12.2% of the September 2026 seasonally adjusted annual rate (derived from Census).
Which state has the most data processing and hosting jobs?
California, with 81,824 private NAICS 518210 jobs in 2025, followed by Texas with 48,266 (BLS QCEW). Washington has the highest concentration at 7.76 per 1,000 private jobs.
Did electrical contractor jobs grow in data center states?
Electrical contractor employment grew 15.9% nationally from 2021 to 2025. In the top 10 data processing states combined it grew 13.3%, led by Texas at 27.1% and Virginia at 26.7% (BLS QCEW).
Do data center projects require union labor?
Not as a rule. Illinois requires a state-approved project labor agreement for data centers in its tax incentive program, which had 34 approved projects through 2025. Three county agreements reviewed in Kentucky, Arizona and South Carolina name no project labor agreement.
What safety standard applies to data center electricians?
OSHA's electrical work practice rules (29 CFR 1910.331 to 1910.335, and Subpart K for construction) are mandatory. NFPA 70E, Standard for Electrical Safety in the Workplace, is the consensus standard many employers follow; its current edition is 2027.
Get the data
Every table in this report is available as a CSV under CC BY 4.0. The fact sheet lists each value with its source URL and access date.
- derived_metrics.csv (CSV)
- fact_sheet.csv (CSV)
- Electrician employment and wages by employer industry, OEWS (CSV)
- U.S. private data center construction spending by year, Census Value of Construction Put in Place (CSV)
- NAICS 518210 data processing and hosting employment by state, 2025, ranked (CSV)
- Electrical contractor employment growth and electrician pay in the top 10 data processing states (CSV)
- Electrical and trade occupations on the payrolls of NAICS 518200 firms, May 2023 to May 2025 (CSV)
- Labor terms in public state and county records for data center projects (CSV)
Cite this report
The figures to cite first
- U.S. private data center construction spending was $67.6 billion in the 12 months to September 2026, 3.87 times the level three years earlier (U.S. Census Bureau, Value of Construction Put in Place).[16]
- BLS counted about 100 electricians on the payrolls of U.S. data processing and hosting firms in May 2024; most data center electricians work for electrical contractors, where the May 2025 median wage was $61,570 (BLS OEWS).[4][1]
- Illinois requires a state-approved project labor agreement for data centers in its Data Center Investment Program, which had 34 approved projects and $10,665,815,092 in investment commitments through 2025 (Illinois DCEO).[30]
Quotable figures
- U.S. private data center construction spending totaled $67.6 billion from October 2025 to September 2026, 3.87 times the $17.5 billion spent from October 2022 to September 2023, according to Census Bureau data.[16]
- Private data center construction in the U.S. ran at a seasonally adjusted annual rate of $96.5 billion in September 2026, up 90.3% from September 2025 (U.S. Census Bureau).[17]
- Data processing and hosting firms employed about 100 electricians nationwide in May 2024, according to BLS OEWS estimates, while electrical contractors employed 541,390 electricians in May 2025.[4][1]
- Electricians at U.S. electrical contractors earned a median annual wage of $61,570 in May 2025 (BLS OEWS).[1]
- Data centers accounted for 8.9% of U.S. private nonresidential construction spending in the 12 months to September 2026, up from 2.4% three years earlier (derived from Census Bureau data).[16]
- U.S. electrical contractor employment grew 15.9% from 2021 to 2025, to 1,123,060 private jobs (BLS QCEW).[11][12]
Summary for editors
Private data center construction in the United States reached $67.6 billion in the 12 months to September 2026, 3.87 times the level of three years earlier, according to Census Bureau data analyzed by the Electrical Contractors and Wiring Data Desk. The September 2026 seasonally adjusted annual rate was $96.5 billion, and data centers took 8.9% of private nonresidential construction spending over the year. Federal wage data show that the electricians doing this work are almost all contractor employees: BLS counted about 100 electricians on data processing and hosting payrolls in May 2024, while electrical contractors employed 541,390 electricians in May 2025 at a median wage of $61,570. Electrical contractor employment grew 15.9% from 2021 to 2025, with Texas at 27.1% and Virginia at 26.7%. Of the state and county records reviewed, only Illinois requires a project labor agreement, as a condition of its data center tax incentive program.
Headlines the data supports
- Data center construction spending hits $96.5 billion annual rate
- Most data center electricians work for contractors, not tech firms, BLS data show
- Data centers now 8.9% of private nonresidential construction
- Electrical contractor jobs up 15.9% since 2021 as data center spending quadruples
- Illinois ties data center tax breaks to project labor agreements
Citation
Electrical Contractors and Wiring. (2026). Data Center Electrician Pay, Jobs and Where the Work Is Growing. Retrieved from https://electricalcontractorsandwiring.com/data/data-center-electrician/
Reuse
Data and tables are licensed CC BY 4.0. Attribution: “Source: Electrical Contractors and Wiring, Data Center Electrician Pay, Jobs and Where the Work Is Growing” with a link to this page.
How we built this report
Source selection: the report uses federal statistical series that publish industry and occupation detail: BLS OEWS national industry, national and state files for May 2023, May 2024 and May 2025; BLS QCEW open data annual averages for 2021 and 2025 and the first quarter of 2026; and the Census Bureau Value of Construction Put in Place monthly time series (release of 2026-11-02). Each file was downloaded unmodified and the extracts used are saved with the report.
Inclusion and exclusion: job board, staffing firm and recruiter salary pages were not used as data. Union statements are cited only as attributed statements. Project labor agreements were counted only when named in a state or county record; agreements reported by unions or the press without a public government record were excluded.
Industry codes: OEWS publishes data processing and hosting at the 4-digit NAICS level (518200) and QCEW at the 6-digit level (518210). Comparisons from 2021 to 2025 assume the industry definition is stable across years. Electrical contractors are NAICS 238210 in OEWS and 23821 in QCEW, which are the same industry.
Conflicts and gaps: BLS published an electrician estimate for NAICS 518200 in May 2023 and May 2024 but not in May 2025, so the report shows the latest published value with its year rather than estimating. Where OEWS marks a cell * or **, the report states that it is not available.
Derived metrics: 12-month construction totals sum not seasonally adjusted monthly values; growth rates and shares are simple ratios; per 1,000 jobs divides state 518210 private employment by state all-industry private employment. Every formula, input row and result is in derived_metrics.csv and the scripts folder.
Limitations: no federal source counts electricians by job site, so data center electricians cannot be counted directly. NAICS 518210 state employment includes software and cloud staff and is only a partial guide to where data centers operate. Census construction data are national and in current dollars. OEWS wages exclude overtime pay and shift differentials, and OEWS excludes the self-employed.
Last updated 2026-11-05. Census construction spending is next released on 2026-12-01; OEWS May 2026 estimates and QCEW 2026 data follow BLS schedules.
This report presents published data with its limitations. It is not legal, financial or investment advice.
Sources by tier
Tier 1: primary and official sources (29)
- [1] U.S. Bureau of Labor Statistics. Occupational Employment and Wage Statistics, May 2025, national industry-specific estimates (oesm25in4). May 2025 (released 2026-05-15). Accessed 2026-11-03.
- [2] U.S. Bureau of Labor Statistics. Occupational Employment and Wage Statistics, May 2025, national cross-industry estimates (oesm25nat). May 2025. Accessed 2026-11-03.
- [3] U.S. Bureau of Labor Statistics. Occupational Employment and Wage Statistics, May 2025, state estimates (oesm25st). May 2025. Accessed 2026-11-03.
- [4] U.S. Bureau of Labor Statistics. Occupational Employment and Wage Statistics, May 2024, national industry-specific estimates (oesm24in4). May 2024. Accessed 2026-11-03.
- [5] U.S. Bureau of Labor Statistics. Occupational Employment and Wage Statistics, May 2023, national industry-specific estimates (oesm23in4). May 2023. Accessed 2026-11-03.
- [6] U.S. Bureau of Labor Statistics. Occupational Employment and Wages, May 2023: 47-2111 Electricians. May 2023. Accessed 2026-11-05.
- [7] U.S. Bureau of Labor Statistics. Occupational Employment and Wages Summary, May 2025 (USDL-26-0725). Released 2026-05-15. Accessed 2026-11-03.
- [8] U.S. Bureau of Labor Statistics. Occupational Outlook Handbook: Electricians. Pay May 2025; jobs 2025. Accessed 2026-11-03.
- [9] U.S. Bureau of Labor Statistics. QCEW open data, 2025 annual averages, NAICS 518210. 2025 annual average (preliminary). Accessed 2026-11-03.
- [10] U.S. Bureau of Labor Statistics. QCEW open data, 2021 annual averages, NAICS 518210. 2021 annual average. Accessed 2026-11-03.
- [11] U.S. Bureau of Labor Statistics. QCEW open data, 2025 annual averages, NAICS 23821. 2025 annual average (preliminary). Accessed 2026-11-03.
- [12] U.S. Bureau of Labor Statistics. QCEW open data, 2021 annual averages, NAICS 23821. 2021 annual average. Accessed 2026-11-03.
- [13] U.S. Bureau of Labor Statistics. QCEW open data, 2025 annual averages, all industries (industry 10). 2025 annual average (preliminary). Accessed 2026-11-03.
- [14] U.S. Bureau of Labor Statistics. QCEW open data, first quarter 2026, NAICS 518210. January to March 2026. Accessed 2026-11-03.
- [15] U.S. Bureau of Labor Statistics. Schedule of news releases and full data availability for County Employment and Wages (QCEW). 2025 and 2026 schedules. Accessed 2026-11-03.
- [16] U.S. Census Bureau. Value of Private Construction Put in Place, not seasonally adjusted, monthly time series (privtime.xlsx). January 2014 to September 2026. Accessed 2026-11-03.
- [17] U.S. Census Bureau. Value of Private Construction Put in Place, seasonally adjusted annual rate, monthly time series (privsatime.xlsx). January 2014 to September 2026. Accessed 2026-11-03.
- [18] U.S. Census Bureau. Monthly Construction Spending, September 2026 (CB26-176). Released 2026-11-02. Accessed 2026-11-03.
- [19] U.S. Census Bureau. Construction Spending: definitions of construction types. Current. Accessed 2026-11-05.
- [20] U.S. Census Bureau. 2026 Economic Indicator Calendar (list view). 2026 schedule. Accessed 2026-11-05.
- [21] U.S. Bureau of Labor Statistics. Industries at a Glance: Data Processing, Hosting, and Related Services, NAICS 518. Current. Accessed 2026-11-05.
- [22] U.S. Bureau of Labor Statistics. OEWS technical notes. Technical notes, May 2024 estimates page. Accessed 2026-11-03.
- [23] Occupational Safety and Health Administration. 29 CFR 1910.332, Training (electrical safety-related work practices). Current regulation. Accessed 2026-11-05.
- [24] Occupational Safety and Health Administration. 29 CFR 1910.333, Selection and use of work practices. Current regulation. Accessed 2026-11-05.
- [25] Occupational Safety and Health Administration. 29 CFR 1926.416, General requirements (construction, Subpart K Electrical). Current regulation. Accessed 2026-11-05.
- [26] Occupational Safety and Health Administration. Electrical: overview. Current. Accessed 2026-11-05.
- [27] U.S. Bureau of Labor Statistics. QCEW Overview. Current. Accessed 2026-11-03.
- [30] Illinois Department of Commerce and Economic Opportunity. Data Center Investment Program, 2025 Annual Report. Program inception to 2025-12-31. Accessed 2026-11-05.
- [31] Mason County, Kentucky. Summary: Development and Community Revenue Agreement, Mason County Fiscal Court meeting. Summary dated 2026-10-06. Accessed 2026-11-05.
Tier 2: trade bodies, market research, company data (4)
- [28] National Fire Protection Association. NFPA 70E standard development page (Standard for Electrical Safety in the Workplace). Current edition 2027. Accessed 2026-11-05.
- [29] electrical training ALLIANCE (IBEW and NECA). electrical training ALLIANCE home page. Current. Accessed 2026-11-05.
- [32] Pima County, Arizona (document copy). Pima County Board of Supervisors addendum item and Binding Memorandum of Agreement, Project Blue (copy hosted by the Federation of American Scientists). Board meeting 2025-12-16. Accessed 2026-11-05.
- [33] Spartanburg County, South Carolina (document copy). Draft ordinance and development agreement, Valara high-performance computing center (copy hosted by WSPA). 2026 draft. Accessed 2026-11-05.
Tier 3: journalism and expert commentary (1)
- [34] International Brotherhood of Electrical Workers. The Data Center Surge: A New Generation of IBEW Jobs, The Electrical Worker (Internet Archive snapshot of 2026-11-02). Article dated 2025-05-01. Accessed 2026-11-05.