Electrical injury statistics: US workplace deaths and injuries from electricity, 2011 to 2024
- Data
- BLS Census of Fatal Occupational Injuries (CFOI) and Survey of Occupational Injuries and Illnesses (SOII), event code 51: exposure to electricity
- Period
- Fatal: 2011 to 2024. Nonfatal: 2018 to 2023-2024. OSHA citations: fiscal year 2026 (preliminary)
- Release used
- 2026-02-19
- Next release
- CFOI 2025 data on 2026-12-16; SOII 2025 data on 2026-11-18
- Geography
- United States
- Sources
- 25 (20 official)
Electrical injury statistics from the U.S. Bureau of Labor Statistics show 130 workers died from exposure to electricity in 2024, down from 142 in 2023, and private employers reported 4,900 electrical injuries with days away from work over 2023-2024. Construction had 40.0% of 2024 deaths, and electricians died from electricity at 26.2 times the all-worker rate.
Electrical injury statistics show 130 deaths in 2024 and a slowly falling trend
Electrical deaths at work fell from 174 in 2011 to 130 in 2024. Single years swing widely, from 166 in 2019 to 126 in 2020, so the three-year average is the better guide: it fell from 157.0 in 2013 to 139.0 in 2024.
The BLS Census of Fatal Occupational Injuries (CFOI) counts every work-related death in the United States. In 2024 it recorded 130 deaths where the event was exposure to electricity, OIICS event code 51, out of 5,070 fatal work injuries (BLS, Feb 19, 2026). The 2023 count was 142 (BLS Table A-9, 2023).
Annual deaths from exposure to electricity and three-year moving average
Source: U.S. Bureau of Labor Statistics, Census of Fatal Occupational Injuries, Table A-9, 2011 to 2024 (2024 data released February 19, 2026); moving average by ECW Data Desk
Across 2011 to 2024 the census counted 2,070 electrical deaths, an average of 147.9 a year. The highest count in the period was 174 in 2011 and the lowest was 126 in 2020, a year when hours worked fell. The three-year moving average shows a gradual decline of 11.5% between 2013 and 2024, smaller than the 25.3% drop between the two endpoint years.
Electricity is also a shrinking share of all work deaths. It accounted for 3.71% of fatal work injuries in 2011 and 2.56% in 2024. Part of that change comes from the denominator: total work deaths rose from 4,693 in 2011 to 5,070 in 2024.
| Year | Electrical fatalities | 3-year moving average | All fatal work injuries | Electricity share of all (%) | Construction electrical fatalities | Construction share of electrical (%) |
|---|---|---|---|---|---|---|
| 2011 | 174 | 4693 | 3.71 | 69 | 39.7 | |
| 2012 | 156 | 4628 | 3.37 | 66 | 42.3 | |
| 2013 | 141 | 157.0 | 4585 | 3.08 | 71 | 50.4 |
| 2014 | 154 | 150.3 | 4821 | 3.19 | 74 | 48.1 |
| 2015 | 134 | 143.0 | 4836 | 2.77 | 81 | 60.4 |
| 2016 | 154 | 147.3 | 5190 | 2.97 | 82 | 53.2 |
| 2017 | 136 | 141.3 | 5147 | 2.64 | 71 | 52.2 |
| 2018 | 160 | 150.0 | 5250 | 3.05 | 86 | 53.8 |
| 2019 | 166 | 154.0 | 5333 | 3.11 | not published | not published |
| 2020 | 126 | 150.7 | 4764 | 2.64 | 53 | 42.1 |
| 2021 | 152 | 148.0 | 5190 | 2.93 | 74 | 48.7 |
| 2022 | 145 | 141.0 | 5486 | 2.64 | 62 | 42.8 |
| 2023 | 142 | 146.3 | 5283 | 2.69 | 66 | 46.5 |
| 2024 | 130 | 139.0 | 5070 | 2.56 | 52 | 40.0 |
Counts are final CFOI data. 2023 forward uses OIICS version 3, so 2011-2022 and 2023-2024 are not strictly comparable. The 2019 construction cell did not meet BLS publication criteria. Moving average and shares are this report's calculations.
Source: [2][3][4] U.S. Bureau of Labor Statistics; U.S. Bureau of Labor Statistics; U.S. Bureau of Labor Statistics
Direct and indirect exposure: Direct exposure means the worker touched the energized part or conductor. Indirect exposure means the current reached the worker through another object, such as a ladder, crane boom, pole or tool, that contacted the source.
| Year | Direct exposure | Indirect exposure | Electric arc | Greater than 220 volts (direct + indirect) | Share greater than 220 volts (%) |
|---|---|---|---|---|---|
| 2011 | 95 | 75 | not coded | 118 | 67.8 |
| 2012 | 76 | 74 | not coded | 120 | 76.9 |
| 2013 | 85 | 52 | not coded | 94 | 66.7 |
| 2014 | 87 | 67 | not coded | 120 | 77.9 |
| 2015 | 83 | 49 | not coded | 96 | 71.6 |
| 2016 | 86 | 66 | not coded | 111 | 72.1 |
| 2017 | 79 | 55 | not coded | 96 | 70.6 |
| 2018 | 82 | 73 | not coded | 115 | 71.9 |
| 2019 | 87 | 76 | not coded | 125 | 75.3 |
| 2020 | 70 | 51 | not coded | 99 | 78.6 |
| 2021 | 98 | 50 | not coded | 106 | 69.7 |
| 2022 | 81 | 58 | not coded | 102 | 70.3 |
| 2023 | 68 | 62 | 5 | 100 | 70.4 |
| 2024 | 61 | 56 | 7 | 82 | 63.1 |
Direct exposure means the worker contacted the energized source; indirect means contact through a conductive object such as a ladder, boom or tool. Electric arc became its own code in 2023. Voltage share is a lower bound because cases with unknown voltage are excluded.
Source: [2][3][4] U.S. Bureau of Labor Statistics; U.S. Bureau of Labor Statistics; U.S. Bureau of Labor Statistics
In 2024, direct exposure accounted for 46.9% of electrical deaths and indirect exposure for 43.1%. Deaths coded as greater than 220 volts made up 63.1%, the lowest share in the series; from 2011 to 2023 the share ranged from 66.7% to 78.6%. Because cases with unknown voltage are excluded, these shares are lower bounds.
Share of electrical fatalities coded as greater than 220 volts (direct plus indirect)
Source: U.S. Bureau of Labor Statistics, Census of Fatal Occupational Injuries, Table A-9, 2011 to 2024
Construction, electricians and line workers carry most of the risk
Private construction accounts for 39.7% to 60.4% of electrical deaths each year, about twice its share of all work deaths. Electricians are the single largest occupation, but most victims work in other trades.
Private construction recorded 52 of the 130 electrical deaths in 2024 (40.0%). Its yearly share ranged from 39.7% in 2011 to 60.4% in 2015. Pooled over 2011 to 2024, excluding 2019 when BLS did not publish the construction cell, construction accounted for 907 of 1,904 electrical deaths, or 47.6%. For comparison, construction had 20.4% of all fatal work injuries in 2024. NIOSH likewise reports that construction, manufacturing, and trade, transportation and utilities had the most electrocutions in 2020 to 2022 (NIOSH).
Electrical fatalities in private construction vs all other industries and ownerships (2019 construction count not published)
Source: U.S. Bureau of Labor Statistics, Census of Fatal Occupational Injuries, Table A-9, 2011 to 2024
By occupation, the BLS CFOI database shows electricians with 295 electrical deaths from 2011 to 2022, an average of 24.6 a year and 16.4% of the 1,798 electrical deaths in that period. Annual counts for electricians ranged from 15 to 28. Grounds maintenance workers followed with 196, then line installers and repairers with 153 and construction laborers with 114. Several of the most affected groups do not do electrical work for a living, which matches OSHA's list of common causes: contact with power lines, missing ground-fault protection, a missing or broken path to ground, equipment misuse and improper use of extension cords (OSHA).
Electrical fatalities by occupation, sum of published years 2011 to 2022
Source: U.S. Bureau of Labor Statistics, CFOI database (fw), event 51 by occupation, 2011 to 2022
| Occupation | Electrical fatalities, 2011-2022 (sum of published years) | Years published | Average per published year | 2022 | Share of all electrical fatalities (%) |
|---|---|---|---|---|---|
| Electricians | 295 | 12 | 24.6 | 25 | 16.4 |
| Grounds maintenance workers | 196 | 12 | 16.3 | 23 | 10.9 |
| Line installers and repairers | 153 | 10 | 15.3 | not published | 8.5 |
| Electrical power-line installers and repairers | 112 | 9 | 12.4 | not published | 6.2 |
| Construction laborers | 114 | 11 | 10.4 | 11 | 6.3 |
| First-line supervisors of construction trades and extraction workers | 88 | 12 | 7.3 | 4 | 4.9 |
| Roofers | 61 | 11 | 5.5 | 3 | 3.4 |
| HVAC and refrigeration mechanics and installers | 47 | 9 | 5.2 | not published | 2.6 |
| All occupations | 1798 | 12 | 149.8 | 145 | 100.0 |
BLS CFOI database series for event 51 (exposure to electricity) by occupation, all sectors. Sums cover only years that met BLS publication criteria. Line installers and repairers include the power-line row below it plus telecommunications line installers. The fw database ends with 2022 data.
Source: [8] U.S. Bureau of Labor Statistics
Counts alone hide exposure. Combining CFOI electrical deaths with the hours worked that BLS publishes for its fatal injury rates gives an electricity-specific rate. For 2018 to 2022, electricians died from electricity at 2.73 per 100,000 full-time equivalent workers, power-line installers at 7.32 and construction laborers at 0.51. The rate for all workers was 0.104, so electricians faced 26.2 times the all-worker rate. Yearly electrician rates ranged from 2.44 in 2020 to 3.18 in 2021.
Deaths from exposure to electricity per 100,000 full-time equivalent workers (derived)
Source: ECW Data Desk calculation from BLS CFOI database (fw) counts and BLS CFOI hours-based rate files, 2018 to 2022
| Group | All-event fatal injury rate 2024 (per 100,000 FTE, BLS) | Electrical deaths 2018-2022 (published years) | Hours worked in those years (millions) | Electricity-specific rate 2018-2022 (per 100,000 FTE, derived) |
|---|---|---|---|---|
| Electrical power-line installers and repairers | 13.8 | 22 | 600.92 | 7.32 |
| Electricians | 5.3 | 123 | 9022.74 | 2.73 |
| Construction laborers | 15.8 | 41 | 15976.89 | 0.51 |
| All workers | 3.3 | 749 | 1436927.54 | 0.104 |
All-event rates are published by BLS for 2024. Electricity-specific rates are this report's calculation: deaths divided by CPS hours worked, times 200 (hours in millions), the BLS formula (N/EH) x 200,000,000. Years with suppressed counts are dropped from both numerator and denominator.
Source: [6][7][8] U.S. Bureau of Labor Statistics; U.S. Bureau of Labor Statistics; U.S. Bureau of Labor Statistics
Electricity is a large part of the electrician's total fatal risk. In 2022 it caused 25 of 75 electrician deaths (33.3%). BLS reported 73 electrician deaths from all events in 2023 and 53 in 2024, and an all-event fatality rate of 5.3 per 100,000 FTE in 2024, down from 7.6 in 2023. Published 2023 and 2024 tables do not split electrician deaths by electricity; the broader harmful-exposure group puts a ceiling of 2.84 per 100,000 FTE on the 2023 electricity rate and 2.4 on the 2024 rate. Readers looking at the trade as a career can compare these figures with the training path in how to become an electrician.
Nonfatal electrical injuries: 4,900 days-away cases in two years, with long recoveries
Private employers reported about 2,450 electrical injuries a year with days away from work in 2023-2024. These cases keep workers out longer than the typical injury, and they are spread more widely across industries than deaths are.
The BLS Survey of Occupational Injuries and Illnesses (SOII) now publishes case details every two years. For 2023-2024 it estimated 4,900 private-industry cases involving days away from work (DAFW) from exposure to electricity, and 6,010 cases when job transfer or restriction cases are added (BLS Table R70). That is 0.27% of all 1,834,600 private-industry DAFW cases in the period.
| Period | DAFW cases from exposure to electricity (period total) | Annual average | Median days away | Share with 31+ days away (%) |
|---|---|---|---|---|
| 2018 | 1560 | 1560 | 4 | 17.3 |
| 2019 | 1900 | 1900 | 9 | 23.2 |
| 2020 | 2220 | 2220 | 3 | 21.2 |
| 2021-2022 | 2950 | 1475 | 5 | 27.1 |
| 2023-2024 | 4900 | 2450 | 10 | 28.2 |
SOII case and demographic estimates. From 2021 BLS publishes two-year totals; the annual average divides by two. OIICS version 3 applies from 2023. Estimates are rounded to tens and carry sampling error.
Source: [10][14] U.S. Bureau of Labor Statistics; U.S. Bureau of Labor Statistics
Annual average cases, private industry (two-year periods divided by two)
Source: U.S. Bureau of Labor Statistics, Survey of Occupational Injuries and Illnesses, case and demographic Table R70, 2018 to 2023-2024 (released January 22, 2026)
The annual average rose from 1,475 cases in 2021-2022 to 2,450 in 2023-2024, a 66.1% increase. The jump coincides with the move to OIICS version 3 and carries sampling error, so it should be read as a signal to watch, not a confirmed trend. Severity is clearer: the median electrical case kept a worker away 10 days in 2023-2024 against 8 days for all injuries, and 28.2% of electrical cases lasted 31 days or more.
Electrical injuries are less concentrated in construction than electrical deaths. Construction had 670 of the 4,900 DAFW cases (13.7%), compared with 43.4% of electrical deaths in 2023 and 2024. Manufacturing had 810 cases and trade, transportation and utilities 1,040. Workers aged 25 to 34 accounted for 1,330 cases (27.1%) (BLS Tables R64 and R60). Roughly 18.0 nonfatal days-away cases were reported for every electrical death in 2023 and 2024, a rough ratio because SOII covers only private-industry employees.
For electrical contractors (NAICS 23821) the leading nonfatal hazards are not electrical. Of their 16,260 DAFW cases in 2023-2024, contact incidents caused 6,520 (40.1%) and falls 5,210 (32.0%), while the harmful-exposure group that contains electricity caused 420 (2.6%). The industry's annualized DAFW rate was 81.0 per 10,000 FTE workers, below 86.6 for all private industry and 94.5 for construction, with a median of 11 days away. Contractor counts by state are in our electrical contractor counts by state report.
By occupation and across all event types, electricians had 12,340 DAFW cases in 2023-2024 with a median of 9 days away, while electrical power-line installers had 3,830 cases with a median of 32 days, among the longest recoveries of any electrical occupation (BLS Table R66).
Lockout/tagout is the only hazardous-energy standard in OSHA's fiscal 2026 top 10
OSHA's preliminary fiscal 2026 list has no electrical wiring or design standard in the all-industry top 10. Electrical standards appear further down, in the general industry ranking.
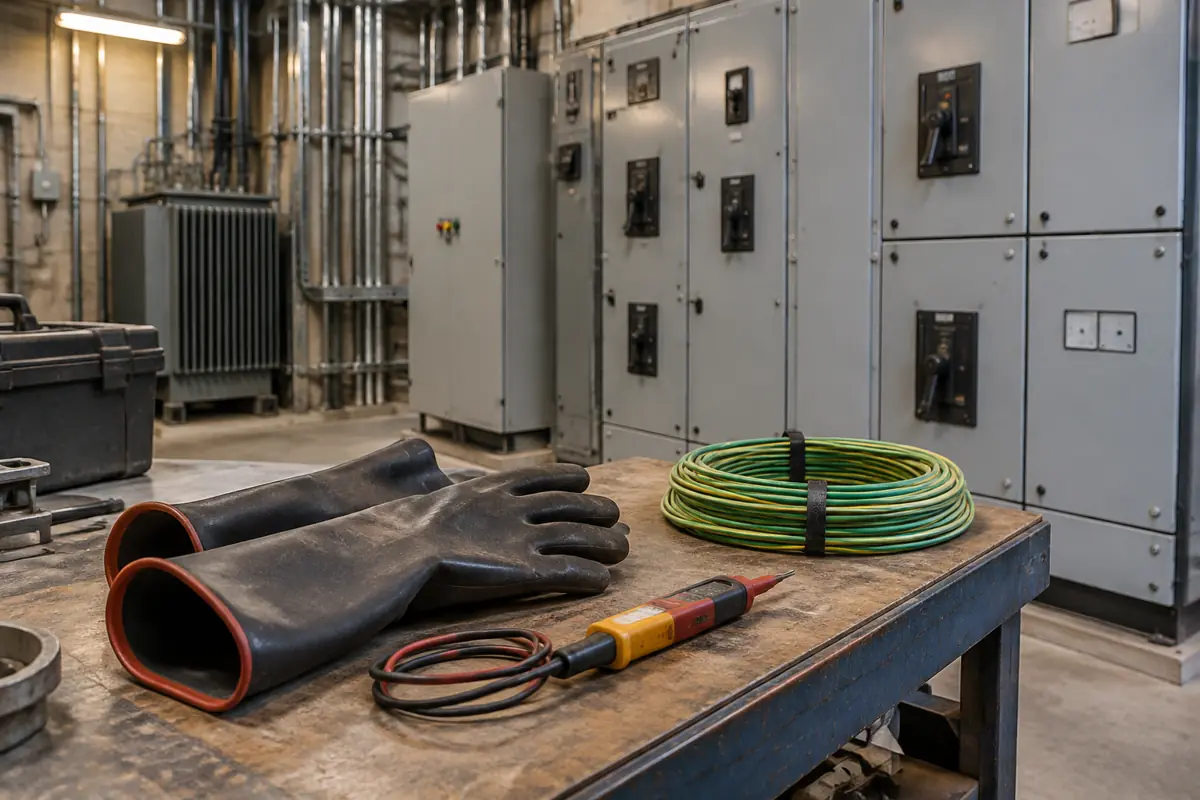
OSHA's preliminary list for fiscal 2026 (Oct 1, 2025 to Aug 31, 2026) ranks fall protection in construction first and control of hazardous energy, known as lockout/tagout (29 CFR 1910.147), third (OSHA). J. J. Keller, reporting OSHA's announcement, put lockout/tagout at 1,863 citations and fall protection at 4,041, down from 5,914 in fiscal 2025 (J. J. Keller).
| Rank | Standard | 29 CFR section | Citations (preliminary) | Electrical relevance |
|---|---|---|---|---|
| 1 | Fall Protection, general requirements, construction | 1926.501 | 4041 | No |
| 2 | Hazard Communication, general industry | 1910.1200 | 1961 | No |
| 3 | Control of Hazardous Energy (lockout/tagout), general industry | 1910.147 | 1863 | Yes: hazardous energy, including electrical |
| 4 | Scaffolding, construction | 1926.451 | 1725 | Indirect |
| 5 | Ladders, construction | 1926.1053 | 1659 | Indirect |
| 6 | Respiratory Protection, general industry | 1910.134 | 1608 | No |
| 7 | Powered Industrial Trucks, general industry | 1910.178 | 1379 | No |
| 8 | Fall Protection Training, construction | 1926.503 | 1273 | No |
| 9 | Eye and Face Protection, construction | 1926.102 | 1120 | No |
| 10 | Machine Guarding, general industry | 1910.212 | 1072 | No |
Ranking from OSHA for Oct 1, 2025 to Aug 31, 2026. Citation counts as reported by J. J. Keller from OSHA's announcement at the NSC Safety Congress on Sept 15, 2026. Electrical relevance is this report's classification.
Source: [15][21] Occupational Safety and Health Administration; J. J. Keller & Associates
Within general industry standards only (Part 1910), J. J. Keller's analysis of preliminary OSHA data ranks electrical general requirements (1910.303) sixth and electrical wiring methods (1910.305) eighth. The average penalty per citation was $2,752 for 1910.303 and $1,965 for 1910.305, compared with $6,836 for lockout/tagout (J. J. Keller). Construction electrical rules (Part 1926 Subpart K) do not appear in either published list. Code requirements behind these standards are covered in our code guide.
What the electrical injury data cannot tell you
The federal data are strong on counts and weak on causes, small groups and recent occupation detail.
- Occupation detail lags: electricity-by-occupation counts are in the BLS fw database only through 2022 data; 2023 and 2024 tables group electricity with all harmful exposures.
- Small counts are suppressed: BLS did not publish the 2019 construction count or several line-installer years, so sums by occupation understate totals.
- Rates are derived: the electricity-specific rates in this report divide CFOI counts by the CPS hours BLS publishes, which are rounded to 100 million hours from 2019 on. They are not official BLS rates.
- Scopes differ: CFOI covers all workers, including the self-employed and government; SOII counts cases reported by private-industry employers (the tables used here), so it does not measure self-employed or government workers in the same way.
- The 2023 coding change (OIICS version 3) affects comparisons across 2022 and 2023, especially for nonfatal cases.
- Neither survey records voltage class reliably for every case, the work task at the moment of contact, or whether a lockout procedure was in place.
- Consumer and home electrical injuries are outside both surveys; those are tracked by other agencies.
The record in numbers
- In 2024, 130 US workers died from exposure to electricity, 2.56% of the 5,070 fatal work injuries that year (BLS CFOI).[1][2]
- US electrical work deaths totaled 2,070 from 2011 to 2024, an average of 147.9 a year (BLS CFOI).[2][3][4]
- US electrical work deaths fell 25.3% from 174 in 2011 to 130 in 2024; the smoothed three-year average fell 11.5% from 2013 to 2024.[2][4]
- Private construction recorded 52 of the 130 US electrical work deaths in 2024 (40.0%) and 66 of 142 in 2023 (46.5%).[2][3]
- From 2011 to 2024, excluding 2019, private construction accounted for 907 of 1,904 US electrical work deaths (47.6%).[2][3][4]
- In 2024, 63.1% of US electrical work deaths involved more than 220 volts, the lowest share since 2011; the range from 2011 to 2023 was 66.7% to 78.6%.[2][3][4]
- US electricians had 295 electrical deaths from 2011 to 2022, between 15 and 28 a year, 16.4% of all electrical deaths in that period (BLS CFOI database).[8]
- Grounds maintenance workers, a non-electrical occupation, had the second-highest US electrical death count from 2011 to 2022 at 196.[8]
- For 2018 to 2022, the derived US electricity-specific fatality rate was 2.73 per 100,000 FTE for electricians and 0.104 for all workers, a ratio of 26.2.[7][8]
- In 2022, electricity caused 25 of the 75 US electrician deaths from all events (33.3%).[5][8]
- US private employers reported 4,900 nonfatal electrical injuries with days away from work in 2023-2024, a median of 10 days away versus 8 days for all injuries.[9][10]
- In 2023-2024, 28.2% of US private-industry electrical days-away cases kept the worker off the job 31 days or more.[10]
- Construction accounted for 13.7% of US private-industry nonfatal electrical days-away cases in 2023-2024 but 43.4% of electrical deaths in 2023 and 2024.[2][3][11]
- US electrical contractors (NAICS 23821) had an annualized days-away rate of 81.0 per 10,000 FTE workers in 2023-2024, below 86.6 for all private industry and 94.5 for construction.[9][13]
- OSHA's preliminary fiscal 2026 list ranks lockout/tagout (29 CFR 1910.147) third with 1,863 citations; no electrical wiring or design standard appears in the all-industry top 10.[15][21]
Rates we calculated
Three-year moving average of electrical deaths
FormulaMA(y) = (E(y) + E(y-1) + E(y-2)) / 3
Inputs: fact sheet rows for electrical deaths 2011 to 2024 (fact sheet rows)
Result: 157.0 in 2013 to 139.0 in 2024 (down 11.5%)
The underlying level of electrical deaths has drifted down slowly; single-year moves such as the drop from 166 in 2019 to 126 in 2020 are mostly noise.
Limitations: Crosses the 2023 OIICS change; 2020 was depressed by lower hours worked.
Construction share of electrical deaths
Formulasum of private construction electrical deaths / sum of all electrical deaths, 2011 to 2024 excluding 2019
Inputs: Table A-9 construction and total rows (fact sheet rows)
Result: 47.6% (907 of 1,904); 40.0% in 2024
Construction carries about twice the share of electrical deaths that it carries of all work deaths (20.4% in 2024).
Limitations: 2019 construction cell not published; government construction workers are outside the numerator.
Electricity-specific fatality rate for electricians
Formulaelectrician electrical deaths / electrician hours (millions) x 200, pooled 2018 to 2022
Inputs: CFOI fw series FWUE514721118ON00 and BLS hours-based rate files (fact sheet rows)
Result: 2.73 per 100,000 FTE vs 0.104 for all workers; ratio 26.2
Per hour worked, an electrician is 26.2 times as likely as the average worker to die from electricity.
Limitations: Own calculation; CPS hours rounded; counts of 15 to 28 a year make single-year rates unstable.
Electricity-specific rate for power-line installers and construction laborers
Formulasame method, years with published counts only
Inputs: CFOI fw series and hours files (fact sheet rows)
Result: power-line installers 7.32; construction laborers 0.51 per 100,000 FTE
Line work carries the highest electrical death rate per hour of the groups measured; construction laborers have many deaths but a low rate because the occupation is large.
Limitations: Line-installer rate rests on two published years (2018 and 2020) and about 600.92 million hours.
Ceiling on the 2023 and 2024 electrician electrical rate
Formulaharmful-exposure deaths (event group 5) / hours x 200
Inputs: CFOI Table A-5 and hours files, 2023 and 2024 (fact sheet rows)
Result: at most 2.84 in 2023 and 2.4 in 2024
Recent years are no worse than the 2018 to 2022 average of 2.73 and may be better.
Limitations: Upper bound only, because group 5 also includes non-electrical exposures.
Nonfatal electrical injuries, annual average
Formulatwo-year SOII total / 2
Inputs: SOII Table R70, 2021-2022 and 2023-2024 (fact sheet rows)
Result: 1,475 a year in 2021-2022 to 2,450 in 2023-2024 (up 66.1%)
Reported nonfatal electrical injuries rose while deaths fell, but the rise overlaps a coding change.
Limitations: OIICS v3 from 2023; sampling error not published for this comparison.
Construction share, fatal vs nonfatal
Formulaconstruction nonfatal DAFW / all nonfatal DAFW vs construction deaths / all deaths, 2023 and 2024
Inputs: SOII Table R64; CFOI Table A-9 2023 and 2024 (fact sheet rows)
Result: 13.7% of nonfatal cases vs 43.4% of deaths
Construction makes up a far larger share of electrical deaths than of nonfatal electrical cases, so its incidents skew toward the fatal end.
Limitations: Different survey scopes.
Nonfatal cases per death
Formulaelectrical DAFW cases 2023-2024 / electrical deaths 2023 + 2024
Inputs: SOII Table R70; CFOI 2023 and 2024 (fact sheet rows)
Result: 18.0 (4,900 / 272)
For every electrical death, about 18 workers lose at least a day of work to an electrical injury.
Limitations: The SOII tables used cover private-industry employer reports only, while CFOI counts all workers, so the ratio mixes scopes.
What people search for
How many electricians die each year?
BLS counted 53 electrician deaths from all causes in 2024, 73 in 2023 and 75 in 2022. Electricity specifically killed an average of 24.6 electricians a year from 2011 to 2022, with a range of 15 to 28.
What is the most common electrical injury at work?
Among nonfatal cases with days away from work in 2023-2024, electrocution or electric shock made up 67.6% of electric-current injuries (3,320 of 4,910) and electrical burns 19.3% (950). Among deaths in 2024, direct contact (46.9%) slightly outnumbered indirect contact through an object (43.1%).
What are the top OSHA electrical violations?
In OSHA's preliminary fiscal 2026 data, lockout/tagout (1910.147) ranked third among all standards with 1,863 citations. Among general industry standards, electrical general requirements (1910.303) ranked sixth and wiring methods (1910.305) eighth, according to J. J. Keller's analysis of OSHA data.
In short
- Exposure to electricity killed 130 US workers in 2024 and 142 in 2023, according to the BLS Census of Fatal Occupational Injuries.
- The three-year moving average of electrical deaths fell from 157.0 in 2013 to 139.0 in 2024, a decline of 11.5%, while all workplace deaths rose.
- Electricity caused 2.56% of all US work deaths in 2024, down from 3.71% in 2011.
- Private construction accounted for 47.6% of electrical deaths from 2011 to 2024 (excluding 2019), roughly twice its 20.4% share of all work deaths in 2024.
- Electricians recorded 295 electrical deaths from 2011 to 2022, an average of 24.6 a year and 16.4% of all electrical deaths.
- For 2018 to 2022, electricians died from electricity at 2.73 per 100,000 full-time workers and power-line installers at 7.32, against 0.104 for all workers (derived rates).
- Private employers reported 4,900 nonfatal electrical injuries with days away from work in 2023-2024, an annual average of 2,450, with a median of 10 days away.
- No electrical-specific standard is in OSHA's all-industry top 10 for fiscal 2026, but lockout/tagout ranks third with 1,863 preliminary citations.
Common questions
How many workers die from electricity each year in the US?
BLS recorded 130 deaths from exposure to electricity in 2024 and 142 in 2023. From 2011 to 2024 the average was 147.9 a year.
Are electrical deaths at work going up or down?
Down slowly. Deaths fell from 174 in 2011 to 130 in 2024, and the three-year moving average fell 11.5% between 2013 and 2024.
What share of workplace deaths are caused by electricity?
Electricity caused 2.56% of US fatal work injuries in 2024, down from 3.71% in 2011.
Which industry has the most electrical deaths?
Construction. Private construction had 52 of the 130 electrical deaths in 2024 (40.0%) and 47.6% of electrical deaths from 2011 to 2024, excluding 2019.
What is the electrical fatality rate for electricians?
Using BLS counts and hours, electricians died from electricity at 2.73 per 100,000 full-time workers from 2018 to 2022, compared with 0.104 for all workers. This is a derived rate, not an official BLS figure.
Which job has the highest electrical death rate?
Among the groups measured, electrical power-line installers and repairers had the highest derived rate, 7.32 per 100,000 full-time workers for the published years 2018 and 2020.
How many nonfatal electrical injuries happen at work?
Private employers reported 4,900 electrical injuries with days away from work over 2023-2024, about 2,450 a year, plus job transfer or restriction cases for a total of 6,010.
How long are workers off after an electrical injury?
The median was 10 days away from work in 2023-2024, compared with 8 days for all injuries, and 28.2% of electrical cases lasted 31 days or more.
Do most people killed by electricity at work have electrical jobs?
No. Electricians accounted for 16.4% of electrical deaths from 2011 to 2022. Grounds maintenance workers, construction laborers, roofers and supervisors also appear among the occupations with the most deaths.
When will new electrical injury statistics be released?
BLS schedules 2025 SOII injury data for Nov 18, 2026 and 2025 CFOI fatality data for Dec 16, 2026.
Get the data
Every table in this report is available as a CSV under CC BY 4.0. The fact sheet lists each value with its source URL and access date.
- derived_metrics.csv (CSV)
- fact_sheet.csv (CSV)
- Fatal work injuries from exposure to electricity, United States, 2011 to 2024 (CSV)
- How electrical fatalities happened: direct, indirect and arc exposure, 2011 to 2024 (CSV)
- Electrical fatalities by occupation, United States, 2011 to 2022 (CSV)
- Fatal injury rates: all events (BLS) and electricity only (derived) (CSV)
- Nonfatal injuries from exposure to electricity involving days away from work, private industry (CSV)
- OSHA top 10 most frequently cited standards, fiscal year 2026 (preliminary) (CSV)
Cite this report
The figures to cite first
- 130 US workers died from exposure to electricity in 2024, down from 142 in 2023 (BLS CFOI, released Feb 19, 2026).[1][2][3]
- US electricians died from electricity at 2.73 per 100,000 FTE in 2018 to 2022, 26.2 times the all-worker rate (derived from BLS CFOI and hours data).[7][8]
- 4,900 nonfatal US electrical injuries with days away from work in 2023-2024, median 10 days away (BLS SOII).[10]
Quotable figures
- Exposure to electricity killed 130 US workers in 2024, 2.56% of all fatal work injuries (BLS CFOI).[1][2]
- From 2018 to 2022, US electricians died from electricity at 2.73 per 100,000 full-time workers, 26.2 times the all-worker rate of 0.104 (ECW calculation from BLS data).[7][8]
- Private construction accounted for 47.6% of US electrical work deaths from 2011 to 2024, excluding 2019, about twice its share of all work deaths.[2][3][4]
- US private employers reported 4,900 nonfatal electrical injuries with days away from work in 2023-2024; 28.2% kept workers out 31 days or more.[10]
- Electricians had 295 electrical deaths in the US from 2011 to 2022, an average of 24.6 a year (BLS CFOI database).[8]
- In 2024, 63.1% of US electrical work deaths involved more than 220 volts (BLS CFOI).[2]
Summary for editors
Exposure to electricity killed 130 US workers in 2024, down from 142 in 2023, according to Bureau of Labor Statistics data analyzed by the Electrical Contractors and Wiring Data Desk. Electrical deaths averaged 147.9 a year from 2011 to 2024, and the three-year moving average fell 11.5% between 2013 and 2024. Private construction accounted for 40.0% of 2024 electrical deaths and 47.6% across 2011 to 2024, excluding 2019. Electricians recorded 295 electrical deaths from 2011 to 2022. Combining BLS death counts with hours worked, electricians died from electricity at 2.73 per 100,000 full-time workers from 2018 to 2022, 26.2 times the rate for all workers, while power-line installers reached 7.32. Private employers also reported 4,900 nonfatal electrical injuries with days away from work in 2023-2024, with a median of 10 days away. OSHA's preliminary fiscal 2026 list ranks lockout/tagout third with 1,863 citations. Data and tables are free to reuse under CC BY 4.0.
Headlines the data supports
- Electricity killed 130 US workers in 2024, BLS data show
- Electricians die from electricity at 26.2 times the average worker rate
- Construction accounts for 40.0% of US electrical work deaths in 2024
- Nonfatal electrical injuries: 4,900 days-away cases in 2023-2024
- Most electrical work deaths still involve more than 220 volts
Citation
Electrical Contractors and Wiring. (2026). Electrical injury statistics: US workplace deaths and injuries from electricity, 2011 to 2024. Retrieved from https://electricalcontractorsandwiring.com/data/electrical-injury-statistics/
Reuse
Data and tables are licensed CC BY 4.0. Attribution: “Source: Electrical Contractors and Wiring, Electrical injury statistics: US workplace deaths and injuries from electricity, 2011 to 2024” with a link to this page.
How we built this report
Selection: the report uses the two federal sources that cover work injuries nationally. Fatal counts come from the BLS Census of Fatal Occupational Injuries, a full census of work deaths, using event code 51 (exposure to electricity) in published Table A-9 for 2011 to 2024 and the BLS fw database for occupation detail through 2022. Nonfatal counts come from the BLS Survey of Occupational Injuries and Illnesses case and demographic tables (R4, R8, R60, R64, R65, R66, R67, R70, R75). OSHA's own top 10 page supplies the citation ranking; citation counts come from J. J. Keller's report of OSHA's announcement.
Inclusion and exclusion: only electricity as the event is counted, not all construction deaths. Deaths that BLS codes to fires or explosions are not counted, even where electricity may have been the ignition source. Secondary summaries (ESFI via EHS Today, EC&M and IAEI) were used only to cross-check: the CFOI sum for 2011 to 2023 equals the 1,940 deaths ESFI reports. ESFI's occupation counts based on OSHA inspection data were not used because they do not match CFOI coverage.
Conflicts: where BLS revised a count, the latest table was used. All CFOI counts are final. Where a cell did not meet BLS publication criteria, it is shown as not published and excluded from sums and rates, never estimated.
Derived metrics: moving averages, shares, changes and electricity-specific rates are computed in scripts/build_outputs.py and listed in derived_metrics.csv with formulas and input rows. Rates follow the BLS formula, deaths divided by hours worked times 200,000,000, using the CPS hours BLS publishes in its hours-based rate files.
Limitations: OIICS version 3 starts with 2023 data; SOII is a sample survey of employer reports with sampling error and, in the tables used, private industry only; CFOI occupation detail by event is not published after 2022; rates for small occupations rest on counts below 30 a year. Home and consumer electrical injuries are outside scope.
Last update: 2026-10-26, using CFOI 2024 data released Feb 19, 2026, SOII 2023-2024 case data released Jan 22, 2026 and OSHA's fiscal 2026 preliminary list updated Oct 5, 2026.
This report presents published data with its limitations. It is not legal, financial or investment advice.
Sources by tier
Tier 1: primary and official sources (20)
- [1] U.S. Bureau of Labor Statistics. BLS, Census of Fatal Occupational Injuries Summary, 2024 (news release USDL-26-0230, Feb 19, 2026). 2024. Accessed 2026-10-26.
- [2] U.S. Bureau of Labor Statistics. BLS CFOI Table A-9: Fatal occupational injuries by event or exposure and major private industry sector, 2024. 2024. Accessed 2026-10-26.
- [3] U.S. Bureau of Labor Statistics. BLS CFOI Table A-9, 2023. 2023. Accessed 2026-10-26.
- [4] U.S. Bureau of Labor Statistics. BLS CFOI archived Table A-9, 2011 to 2022. 2011-2022. Accessed 2026-10-26.
- [5] U.S. Bureau of Labor Statistics. BLS CFOI Table A-5: Fatal occupational injuries by occupation and event or exposure, 2022 to 2024. 2022-2024. Accessed 2026-10-26.
- [6] U.S. Bureau of Labor Statistics. BLS CFOI national hours-based fatal injury rates by occupation, 2024. 2024. Accessed 2026-10-26.
- [7] U.S. Bureau of Labor Statistics. BLS CFOI hours-based fatal injury rates, 2018 to 2023 (archive). 2018-2023. Accessed 2026-10-26.
- [8] U.S. Bureau of Labor Statistics. BLS CFOI database (fw), exposure to electricity by occupation, series FWUE51…ON00, 2011 to 2022. 2011-2022. Accessed 2026-10-26.
- [9] U.S. Bureau of Labor Statistics. BLS, Employer-Reported Workplace Injuries and Illnesses, 2023-2024 (news release USDL-26-0101, Jan 22, 2026). 2023-2024. Accessed 2026-10-26.
- [10] U.S. Bureau of Labor Statistics. BLS SOII case and demographic Table R70: cases by event or exposure and days away from work, 2023-2024. 2023-2024. Accessed 2026-10-26.
- [11] U.S. Bureau of Labor Statistics. BLS SOII case and demographic Tables R64, R60 and R75: cases and rates by event or exposure, industry sector and age, 2023-2024. 2023-2024. Accessed 2026-10-26.
- [12] U.S. Bureau of Labor Statistics. BLS SOII case and demographic Tables R66 and R67: cases by occupation and by nature, with median days, 2023-2024. 2023-2024. Accessed 2026-10-26.
- [13] U.S. Bureau of Labor Statistics. BLS SOII case and demographic Tables R4, R8 and R65: cases, rates and median days by industry, 2023-2024. 2023-2024. Accessed 2026-10-26.
- [14] U.S. Bureau of Labor Statistics. BLS SOII case and demographic historical Table R70, 2018, 2019, 2020 and 2021-2022. 2018-2022. Accessed 2026-10-26.
- [15] Occupational Safety and Health Administration. Top 10 Most Frequently Cited Standards for Fiscal Year 2026 (Oct. 1, 2025, to Aug. 31, 2026). FY2026 (Oct 1, 2025 to Aug 31, 2026). Accessed 2026-10-26.
- [16] Occupational Safety and Health Administration. Electrical: Overview and hazard recognition. current page. Accessed 2026-10-26.
- [17] National Institute for Occupational Safety and Health (CDC). About Electrical Safety. page dated Feb 14, 2024. Accessed 2026-10-26.
- [18] U.S. Bureau of Labor Statistics. Occupational Injury and Illness Classification (OIICS) Manual. OIICS v3 (2023 forward). Accessed 2026-10-26.
- [19] U.S. Bureau of Labor Statistics. Census of Fatal Occupational Injuries (CFOI): Definitions. current. Accessed 2026-10-26.
- [20] U.S. Bureau of Labor Statistics. BLS 2026 release calendar. 2026. Accessed 2026-10-26.
Tier 2: trade bodies, market research, company data (3)
- [21] J. J. Keller & Associates. Fall protection for construction continues to lead OSHA's Top 10 list (Sept 21, 2026). FY2026 preliminary. Accessed 2026-10-26.
- [22] J. J. Keller & Associates. Expert Insights: New data reveals top 20 OSHA 1910 violations for FY 2026 (Oct 2, 2026). FY2026 preliminary. Accessed 2026-10-26.
- [25] IAEI Magazine. Workplace Electrical Injuries and Fatalities Data From 2003-2020 (ESFI analysis). 2003-2020. Accessed 2026-10-26.
Tier 3: journalism and expert commentary (2)
- [23] EHS Today. Electrical Fatalities Remain Same Year-Over-Year (Feb 13, 2025), reporting ESFI analysis of BLS and OSHA data. 2011-2023. Accessed 2026-10-26.
- [24] EC&M. Electrical Safety Foundation International Releases Updated Workplace Safety Statistics (Feb 7, 2025). 2011-2023. Accessed 2026-10-26.