Average Electric Bill by State: 2025 Bills, 2026 Price Changes and What Drives the Gap
- Data
- EIA-861 2025 residential average monthly bill; EIA Electric Power Monthly Tables 5.6.A and 5.6.B; EIA-861M
- Period
- 2015 to August 2026 (monthly price); 2024 and 2025 (state bills)
- Release used
- 2026-10-23
- Next release
- 2026-11-24 (Electric Power Monthly, September 2026 data)
- Geography
- 50 states, District of Columbia, United States
- Sources
- 22 (19 official)
The average electric bill for a US home was $150.68 a month in 2025, for 874 kWh at 17.23 cents per kWh (EIA-861). Hawaii was highest at $207.89 and New Mexico lowest at $94.65. Residential prices rose 6.8% in January to August 2026 versus 2025. Price, not usage, explains most state gaps.
US residential electricity prices rose 31.0% from 2020 to 2025, faster than inflation
After five flat years near 13 cents, the US residential price climbed from 13.15 cents per kWh in 2020 to 17.23 cents in 2025 and averaged 18.19 cents in the first eight months of 2026.
Cents per kWh, all residential revenue divided by kWh sold; 2026 months preliminary
Source: U.S. Energy Information Administration, Form EIA-861M sales and revenue file (August 2026 data, released October 23, 2026)
The US average residential electricity price was 12.65 cents per kWh in 2015 and 13.15 cents in 2020, then rose every year to 17.23 cents in 2025, a 36.2% increase over ten years (EIA-861M). The steepest single-year step was 2022, from 13.66 to 15.04 cents.
Monthly prices swing seasonally, and the yearly high in average price per kWh fell in April, September or October from 2023 to 2026, not in midsummer. The August 2026 US residential price was 18.16 cents per kWh (preliminary), 0.59 cents or 3.4% above August 2025. Over the rolling 12 months to August 2026 the price averaged 18.04 cents, 6.5% above the prior 12 months (EIA Electric Power Monthly, released October 23, 2026).
| Year | US residential price (cents/kWh) | Average monthly bill, EIA-861M basis ($) | Average monthly use (kWh) | CPI-U all items, annual average (1982-84=100) | EIA data status |
|---|---|---|---|---|---|
| 2015 | 12.65 | 114.03 | 901 | 237.017 | Final |
| 2016 | 12.55 | 112.59 | 897 | 240.007 | Final |
| 2017 | 12.89 | 111.67 | 867 | 245.120 | Final |
| 2018 | 12.87 | 117.65 | 914 | 251.107 | Final |
| 2019 | 13.01 | 115.49 | 887 | 255.657 | Final |
| 2020 | 13.15 | 117.46 | 893 | 258.811 | Final |
| 2021 | 13.66 | 121.01 | 886 | 270.970 | Final |
| 2022 | 15.04 | 135.25 | 899 | 292.655 | Final |
| 2023 | 16.00 | 136.84 | 855 | 304.702 | Final |
| 2024 | 16.48 | 142.26 | 863 | 313.689 | Final |
| 2025 | 17.23 | 150.68 | 874 | 321.943 | Final |
Price = residential revenue / kWh sold; bill = revenue / average customers / 12. Computed from EIA-861M annual rows; 2024 and 2025 match the EIA-861 published bill tables. CPI-U 2025 average excludes uncollected October 2025.
Source: [8][9] U.S. Energy Information Administration; U.S. Bureau of Labor Statistics
Monthly; EIA average residential price and BLS CPI-U all items, both rebased; October 2025 CPI not collected
Source: EIA-861M (August 2026 data); BLS CPI-U CUUR0000SA0 (September 2026 data); Data Desk rebasing
Measured against inflation, the US residential price rose 31.0% from 2020 to 2025 while CPI-U all items rose 24.4%, so electricity got 5.3% more expensive in real terms. From August 2020 to August 2026 the price rose 37.0% against 28.9% for CPI-U, a real increase of 6.3% (BLS CPI flat files). The BLS electricity index, which tracks a constant-quality service price, rose 36.1% from 2020 to 2025.
| Measure | 2020 annual | 2025 annual | Change 2020 to 2025 (%) | Aug 2020 | Aug 2026 | Change Aug 2020 to Aug 2026 (%) |
|---|---|---|---|---|---|---|
| US residential electricity price, EIA (cents/kWh) | 13.15 | 17.23 | 31.0 | 13.26 | 18.16 | 37.0 |
| CPI-U all items, BLS (1982-84=100) | 258.811 | 321.943 | 24.4 | 259.918 | 334.980 | 28.9 |
| CPI-U electricity, BLS (1982-84=100) | 214.615 | 292.027 | 36.1 | 217.680 | 310.057 | 42.4 |
| EIA residential price deflated by CPI-U (real change) | 5.3 | 6.3 |
Real change = price ratio / CPI-U ratio – 1. The CPI electricity index measures a constant-quality service price and is shown for comparison.
Source: [8][9][10] U.S. Energy Information Administration; U.S. Bureau of Labor Statistics; U.S. Bureau of Labor Statistics
Lawrence Berkeley National Laboratory (July 2026 update) reaches a similar result over a longer window: nominal residential prices rose 33% from 2019 to 2025 and 5.6% after inflation, and the average residential bill equalled 2.4% of total household expenditure in 2025.
The EIA Short-Term Energy Outlook, October 2026 forecasts an average residential price of 18.21 cents per kWh in 2026 and 18.68 cents in 2027, rises of 5.3% and 2.6% on its own 2025 figure of 17.30 cents. These are forecasts, not data. STEO's 2025 figure differs from the final EPM value of 17.23 cents.
Average residential price (cents per kWh): Total residential electricity revenue divided by total residential kWh sold. It folds fixed monthly charges, delivery charges and energy charges into one number, so it is not the rate printed on any single tariff.
Average electric bill by state: Hawaii and Connecticut topped $200 a month in 2025
Average monthly bills in 2025 ranged from $94.65 in New Mexico to $207.89 in Hawaii. 21 jurisdictions were above the US average of $150.68.
US dollars per month; darker tiles are higher bills
Source: U.S. Energy Information Administration, EIA-861 2025 final data, Average Monthly Bill, Residential (released October 7, 2026)
EIA's 2025 residential bill table, released October 7, 2026, puts the average US bill at $150.68 a month across 144,800,940 residential customer accounts (EIA-861, 2025 final data). The five highest bills were Hawaii ($207.89), Connecticut ($206.46), Maryland ($184.42), Alabama ($184.31) and Massachusetts ($181.08).
The five lowest were New Mexico ($94.65), Utah ($99.06), Colorado ($103.30), Idaho ($110.36) and Montana ($110.80). High bills come from two different routes: Hawaii and Connecticut through price, Alabama and Texas ($170.95) through usage.
Show all 52 rows
| Rank (highest bill = 1) | State | Average monthly bill 2025 ($) | Average monthly use 2025 (kWh) | Average price 2025 (cents/kWh) | Average monthly bill 2024 ($) | Bill change 2024 to 2025 (%) |
|---|---|---|---|---|---|---|
| 1 | Hawaii | 207.89 | 515 | 40.40 | 212.12 | -2.0 |
| 2 | Connecticut | 206.46 | 704 | 29.31 | 199.66 | 3.4 |
| 3 | Maryland | 184.42 | 944 | 19.53 | 165.87 | 11.2 |
| 4 | Alabama | 184.31 | 1,145 | 16.09 | 173.50 | 6.2 |
| 5 | Massachusetts | 181.08 | 596 | 30.41 | 167.20 | 8.3 |
| 6 | Texas | 170.95 | 1,110 | 15.40 | 163.72 | 4.4 |
| 7 | Florida | 167.86 | 1,103 | 15.21 | 156.09 | 7.5 |
| 8 | Mississippi | 166.05 | 1,184 | 14.03 | 154.83 | 7.3 |
| 9 | Rhode Island | 165.62 | 562 | 29.48 | 162.40 | 2.0 |
| 10 | West Virginia | 165.13 | 1,073 | 15.39 | 154.76 | 6.7 |
| 11 | Virginia | 163.05 | 1,067 | 15.28 | 148.77 | 9.6 |
| 12 | Pennsylvania | 161.90 | 839 | 19.29 | 145.17 | 11.5 |
| 13 | South Carolina | 161.21 | 1,066 | 15.12 | 149.51 | 7.8 |
| 14 | Georgia | 158.70 | 1,077 | 14.74 | 151.25 | 4.9 |
| 15 | Delaware | 157.80 | 920 | 17.15 | 150.87 | 4.6 |
| 16 | Arizona | 157.15 | 1,030 | 15.26 | 160.24 | -1.9 |
| 17 | New Hampshire | 156.94 | 640 | 24.53 | 144.87 | 8.3 |
| 18 | Tennessee | 156.03 | 1,180 | 13.22 | 143.32 | 8.9 |
| 19 | New York | 154.75 | 586 | 26.39 | 139.53 | 10.9 |
| 20 | California | 154.73 | 494 | 31.35 | 160.86 | -3.8 |
| 21 | Louisiana | 153.32 | 1,225 | 12.52 | 140.96 | 8.8 |
| 22 | New Jersey | 150.59 | 670 | 22.48 | 128.13 | 17.5 |
| 23 | Indiana | 149.72 | 938 | 15.96 | 133.06 | 12.5 |
| 24 | Ohio | 147.74 | 874 | 16.90 | 135.16 | 9.3 |
| 25 | Maine | 147.67 | 533 | 27.69 | 133.60 | 10.5 |
| 26 | Alaska | 147.18 | 564 | 26.11 | 143.54 | 2.5 |
| 27 | North Carolina | 146.14 | 1,044 | 14.00 | 143.50 | 1.8 |
| 28 | Kentucky | 143.72 | 1,094 | 13.13 | 133.81 | 7.4 |
| 29 | Oklahoma | 140.52 | 1,064 | 13.21 | 132.05 | 6.4 |
| 30 | District of Columbia | 140.05 | 639 | 21.92 | 113.23 | 23.7 |
| 31 | Arkansas | 138.42 | 1,076 | 12.87 | 129.13 | 7.2 |
| 32 | Missouri | 137.97 | 1,037 | 13.30 | 129.18 | 6.8 |
| 33 | Vermont | 134.78 | 591 | 22.79 | 125.66 | 7.3 |
| 34 | Oregon | 133.89 | 866 | 15.46 | 129.62 | 3.3 |
| 35 | South Dakota | 131.10 | 984 | 13.32 | 127.81 | 2.6 |
| 36 | Michigan | 127.17 | 635 | 20.03 | 119.31 | 6.6 |
| 37 | Illinois | 126.59 | 716 | 17.67 | 109.99 | 15.1 |
| 38 | Kansas | 126.42 | 876 | 14.44 | 123.90 | 2.0 |
| 39 | North Dakota | 126.40 | 1,070 | 11.82 | 118.38 | 6.8 |
| 40 | Washington | 124.41 | 945 | 13.17 | 113.68 | 9.4 |
| 41 | Wisconsin | 120.60 | 667 | 18.08 | 110.87 | 8.8 |
| 42 | Minnesota | 117.67 | 743 | 15.83 | 110.06 | 6.9 |
| 43 | Iowa | 117.30 | 861 | 13.62 | 111.54 | 5.2 |
| 44 | Nebraska | 117.23 | 973 | 12.05 | 110.28 | 6.3 |
| 45 | Nevada | 115.07 | 868 | 13.26 | 139.39 | -17.4 |
| 46 | Wyoming | 111.59 | 835 | 13.37 | 107.65 | 3.7 |
| 47 | Montana | 110.80 | 853 | 12.99 | 107.91 | 2.7 |
| 48 | Idaho | 110.36 | 933 | 11.83 | 108.73 | 1.5 |
| 49 | Colorado | 103.30 | 658 | 15.69 | 100.57 | 2.7 |
| 50 | Utah | 99.06 | 761 | 13.02 | 94.57 | 4.7 |
| 51 | New Mexico | 94.65 | 638 | 14.85 | 92.88 | 1.9 |
| United States | 150.68 | 874 | 17.23 | 142.26 | 5.9 |
EIA-861 annual data, all residential customer accounts. Bill is average revenue per customer per month, so it includes fixed charges and any taxes recorded as revenue.
Source: [1][2] U.S. Energy Information Administration; U.S. Energy Information Administration
Bills rose from 2024 to 2025 in 47 of 51 jurisdictions. The District of Columbia rose most (23.7%, to $140.05), followed by New Jersey (17.5%) and Illinois (15.1%). Nevada fell 17.4% as both its price and its average usage dropped in the EIA-861 data.
A more recent national estimate comes from the monthly EIA-861M survey. Averaging monthly revenue per customer over September 2025 to August 2026 gives $157.80 a month, 6.7% above $147.88 for the prior 12 months (EIA-861M, preliminary). This is a Data Desk calculation, not an EIA published bill.
Residential prices rose in 48 of 51 jurisdictions in 2026 so far, led by DC, New Hampshire and Hawaii
January to August 2026 residential prices were 6.8% above 2025 nationally. In August alone the rise was 3.4%, with 44 jurisdictions up and 7 down.
Percent change in cents per kWh, top 20 of 51 jurisdictions; August 2026 preliminary
Source: Electrical Contractors and Wiring Data Desk calculation from EIA Electric Power Monthly Table 5.6.A (released October 23, 2026)
Comparing August 2026 with August 2025, Hawaii's residential price rose 22.5% to 47.18 cents per kWh, Maine's 14.1% to 32.11 cents and New Hampshire's 13.1% to 27.64 cents (EIA Electric Power Monthly Table 5.6.A). 31 jurisdictions rose faster than the US average of 3.4%.
On a year-to-date basis, which smooths single-month swings, the largest rises were the District of Columbia (17.2%), New Hampshire (15.0%), Hawaii (14.7%), Virginia (13.0%) and Ohio (13.0%) (EIA Table 5.6.B).
Show all 52 rows
| Rank (fastest rise = 1) | State | Aug 2026 (cents/kWh, preliminary) | Aug 2025 (cents/kWh) | 12-month change (%) | Jan-Aug 2026 YTD (cents/kWh) | Jan-Aug 2025 YTD (cents/kWh) | YTD change (%) |
|---|---|---|---|---|---|---|---|
| 1 | Hawaii | 47.18 | 38.53 | 22.5 | 46.41 | 40.46 | 14.7 |
| 2 | Maine | 32.11 | 28.14 | 14.1 | 30.23 | 27.47 | 10.0 |
| 3 | New Hampshire | 27.64 | 24.44 | 13.1 | 26.91 | 23.40 | 15.0 |
| 4 | District of Columbia | 25.98 | 23.18 | 12.1 | 24.86 | 21.22 | 17.2 |
| 5 | Virginia | 17.64 | 15.85 | 11.3 | 16.95 | 15.00 | 13.0 |
| 6 | Delaware | 18.70 | 16.85 | 11.0 | 17.98 | 16.79 | 7.1 |
| 7 | Michigan | 22.99 | 20.73 | 10.9 | 21.73 | 19.94 | 9.0 |
| 8 | Idaho | 13.37 | 12.08 | 10.7 | 13.02 | 11.65 | 11.8 |
| 9 | Ohio | 19.38 | 17.55 | 10.4 | 18.81 | 16.64 | 13.0 |
| 10 | Iowa | 17.06 | 15.48 | 10.2 | 14.55 | 13.72 | 6.0 |
| 11 | Pennsylvania | 21.77 | 19.93 | 9.2 | 21.13 | 18.86 | 12.0 |
| 12 | South Dakota | 15.15 | 13.90 | 9.0 | 14.58 | 13.20 | 10.5 |
| 13 | Montana | 15.57 | 14.29 | 9.0 | 14.13 | 12.76 | 10.7 |
| 14 | Vermont | 23.84 | 22.10 | 7.9 | 23.93 | 22.30 | 7.3 |
| 15 | Arkansas | 14.37 | 13.33 | 7.8 | 13.74 | 12.74 | 7.8 |
| 16 | Maryland | 21.40 | 19.89 | 7.6 | 21.31 | 18.93 | 12.6 |
| 17 | New York | 28.65 | 26.64 | 7.5 | 29.26 | 26.10 | 12.1 |
| 18 | Illinois | 19.32 | 18.03 | 7.2 | 19.23 | 17.44 | 10.3 |
| 19 | Washington | 14.63 | 13.65 | 7.2 | 14.42 | 12.91 | 11.7 |
| 20 | Rhode Island | 28.18 | 26.53 | 6.2 | 29.05 | 29.09 | -0.1 |
| 21 | Mississippi | 14.43 | 13.61 | 6.0 | 15.06 | 13.87 | 8.6 |
| 22 | Colorado | 17.17 | 16.21 | 5.9 | 16.80 | 15.47 | 8.6 |
| 23 | Nebraska | 13.54 | 12.80 | 5.8 | 12.92 | 11.94 | 8.2 |
| 24 | Alaska | 29.41 | 27.79 | 5.8 | 27.32 | 26.07 | 4.8 |
| 25 | Kansas | 15.47 | 14.65 | 5.6 | 15.26 | 14.27 | 6.9 |
| 26 | Wisconsin | 19.41 | 18.44 | 5.3 | 19.05 | 18.02 | 5.7 |
| 27 | Kentucky | 13.80 | 13.10 | 5.3 | 14.20 | 13.04 | 8.9 |
| 28 | Indiana | 17.02 | 16.21 | 5.0 | 17.04 | 15.69 | 8.6 |
| 29 | Missouri | 16.02 | 15.32 | 4.6 | 14.28 | 13.32 | 7.2 |
| 30 | West Virginia | 16.31 | 15.62 | 4.4 | 15.58 | 15.37 | 1.4 |
| 31 | South Carolina | 15.76 | 15.16 | 4.0 | 15.90 | 14.98 | 6.1 |
| 32 | Texas | 15.91 | 15.40 | 3.3 | 16.03 | 15.18 | 5.6 |
| 33 | New Mexico | 16.51 | 15.98 | 3.3 | 15.34 | 14.68 | 4.5 |
| 34 | Oklahoma | 14.82 | 14.42 | 2.8 | 13.81 | 12.95 | 6.6 |
| 35 | North Dakota | 13.31 | 12.97 | 2.6 | 12.46 | 11.67 | 6.8 |
| 36 | North Carolina | 14.95 | 14.59 | 2.5 | 14.94 | 13.81 | 8.2 |
| 37 | Tennessee | 13.42 | 13.09 | 2.5 | 13.80 | 13.24 | 4.2 |
| 38 | Louisiana | 12.87 | 12.55 | 2.5 | 13.27 | 12.54 | 5.8 |
| 39 | Georgia | 15.90 | 15.55 | 2.3 | 15.48 | 14.86 | 4.2 |
| 40 | Minnesota | 17.20 | 16.89 | 1.8 | 16.44 | 15.78 | 4.2 |
| 41 | Nevada | 12.72 | 12.54 | 1.4 | 13.36 | 13.10 | 2.0 |
| 42 | Wyoming | 14.43 | 14.33 | 0.7 | 14.01 | 13.08 | 7.1 |
| 43 | Alabama | 16.33 | 16.26 | 0.4 | 16.51 | 16.01 | 3.1 |
| 44 | Oregon | 15.92 | 15.85 | 0.4 | 15.46 | 15.37 | 0.6 |
| 45 | Massachusetts | 30.48 | 30.55 | -0.2 | 30.19 | 30.21 | -0.1 |
| 46 | Arizona | 15.05 | 15.09 | -0.3 | 15.36 | 15.18 | 1.2 |
| 47 | New Jersey | 24.61 | 24.70 | -0.4 | 24.09 | 22.32 | 7.9 |
| 48 | Florida | 14.99 | 15.33 | -2.2 | 15.32 | 15.04 | 1.9 |
| 49 | Utah | 13.31 | 13.62 | -2.3 | 13.19 | 12.84 | 2.7 |
| 50 | California | 29.75 | 30.92 | -3.8 | 32.58 | 31.11 | 4.7 |
| 51 | Connecticut | 24.51 | 30.17 | -18.8 | 27.47 | 30.21 | -9.1 |
| United States | 18.16 | 17.57 | 3.4 | 18.19 | 17.03 | 6.8 |
Cents per kWh. August 2026 and January to August 2026 values are preliminary. Single-month changes are volatile; the year-to-date column is steadier.
Source: [3][4] U.S. Energy Information Administration; U.S. Energy Information Administration
EIA's explanation for 2026 price pressure is in its October outlook: wholesale prices across 11 hubs are forecast to average $52 per MWh in 2026, 11% above 2025, with PJM up 41%, after winter storm Fern and a hot July; EIA adds that residential prices also carry transmission and distribution upgrades and, in some regions, capacity market auction costs (EIA Short-Term Energy Outlook, October 2026).
Price explains the bill gap in 28 jurisdictions, usage in 23
Hawaii's bill is $57.21 above the US average because of price, even though its homes use far less electricity. Louisiana's bill is close to average because high usage offsets a low price.
Every bill is price times usage. To separate the two, each state's 2025 gap from the US average bill is split with a midpoint (Shapley) decomposition: price effect = (state price – US price) x (state kWh + US kWh) / 2, and usage effect = (state kWh – US kWh) x (state price + US price) / 2. The two effects add up exactly to the gap, with no residual.
US dollars per month; the two bars sum to the state's bill minus the US average of $150.68
Source: Electrical Contractors and Wiring Data Desk midpoint decomposition of EIA-861 2025 average price and consumption
Hawaii's bill is $57.21 above the US average: a price effect of +160.84 dollars partly cancelled by a usage effect of -103.63. Connecticut, Massachusetts and California follow the same pattern (Connecticut +95.33 price, -39.55 usage; Massachusetts +96.80 price, -66.40 usage; California +96.55 price, -92.50 usage). In Louisiana a price effect of -49.51 is offset by a usage effect of +52.15, leaving the bill $2.64 above average.
The two forces usually push against each other. In 40 of 51 jurisdictions the price and usage effects have opposite signs, and across states the log price and log usage correlate at -0.81. The bill itself correlates more with price (r = 0.56) than with usage (r = 0.09).
Show all 51 rows
| State | Average monthly bill 2025 ($) | Gap vs US average bill ($) | Price effect ($) | Usage effect ($) | Larger driver |
|---|---|---|---|---|---|
| Hawaii | 207.89 | +57.21 | +160.84 | -103.63 | price |
| Connecticut | 206.46 | +55.78 | +95.33 | -39.55 | price |
| Maryland | 184.42 | +33.74 | +20.84 | +12.90 | price |
| Alabama | 184.31 | +33.63 | -11.55 | +45.18 | usage |
| Massachusetts | 181.08 | +30.40 | +96.80 | -66.40 | price |
| Texas | 170.95 | +20.27 | -18.23 | +38.50 | usage |
| Florida | 167.86 | +17.18 | -19.98 | +37.15 | usage |
| Mississippi | 166.05 | +15.38 | -33.00 | +48.38 | usage |
| Rhode Island | 165.62 | +14.95 | +87.93 | -72.98 | price |
| West Virginia | 165.13 | +14.45 | -17.97 | +32.42 | usage |
| Virginia | 163.05 | +12.37 | -18.95 | +31.32 | usage |
| Pennsylvania | 161.90 | +11.22 | +17.61 | -6.39 | price |
| South Carolina | 161.21 | +10.53 | -20.56 | +31.09 | usage |
| Georgia | 158.70 | +8.02 | -24.32 | +32.34 | usage |
| Delaware | 157.80 | +7.12 | -0.77 | +7.89 | usage |
| Arizona | 157.15 | +6.48 | -18.82 | +25.29 | usage |
| New Hampshire | 156.94 | +6.26 | +55.21 | -48.95 | price |
| Tennessee | 156.03 | +5.36 | -41.26 | +46.61 | usage |
| New York | 154.75 | +4.07 | +66.88 | -62.82 | price |
| California | 154.73 | +4.06 | +96.55 | -92.50 | price |
| Louisiana | 153.32 | +2.64 | -49.51 | +52.15 | usage |
| New Jersey | 150.59 | -0.09 | +40.52 | -40.62 | usage |
| Indiana | 149.72 | -0.96 | -11.53 | +10.57 | price |
| Ohio | 147.74 | -2.94 | -2.90 | -0.04 | price |
| Maine | 147.67 | -3.01 | +73.61 | -76.62 | usage |
| Alaska | 147.18 | -3.49 | +63.82 | -67.31 | usage |
| North Carolina | 146.14 | -4.54 | -31.06 | +26.51 | price |
| Kentucky | 143.72 | -6.96 | -40.36 | +33.40 | price |
| Oklahoma | 140.52 | -10.16 | -39.05 | +28.89 | price |
| District of Columbia | 140.05 | -10.63 | +35.46 | -46.08 | usage |
| Arkansas | 138.42 | -12.26 | -42.57 | +30.31 | price |
| Missouri | 137.97 | -12.71 | -37.62 | +24.91 | price |
| Vermont | 134.78 | -15.90 | +40.69 | -56.59 | usage |
| Oregon | 133.89 | -16.79 | -15.41 | -1.38 | price |
| South Dakota | 131.10 | -19.57 | -36.35 | +16.77 | price |
| Michigan | 127.17 | -23.51 | +21.11 | -44.62 | usage |
| Illinois | 126.59 | -24.09 | +3.45 | -27.54 | usage |
| Kansas | 126.42 | -24.26 | -24.50 | +0.24 | price |
| North Dakota | 126.40 | -24.28 | -52.68 | +28.40 | price |
| Washington | 124.41 | -26.27 | -36.95 | +10.68 | price |
| Wisconsin | 120.60 | -30.08 | +6.51 | -36.58 | usage |
| Minnesota | 117.67 | -33.01 | -11.39 | -21.62 | usage |
| Iowa | 117.30 | -33.38 | -31.32 | -2.06 | price |
| Nebraska | 117.23 | -33.44 | -47.83 | +14.39 | price |
| Nevada | 115.07 | -35.61 | -34.59 | -1.02 | price |
| Wyoming | 111.59 | -39.09 | -33.04 | -6.04 | price |
| Montana | 110.80 | -39.88 | -36.61 | -3.27 | price |
| Idaho | 110.36 | -40.32 | -48.82 | +8.49 | price |
| Colorado | 103.30 | -47.38 | -11.81 | -35.57 | usage |
| Utah | 99.06 | -51.62 | -34.49 | -17.13 | price |
| New Mexico | 94.65 | -56.03 | -18.05 | -37.98 | usage |
Midpoint decomposition: price effect = (state price – US price) x (state kWh + US kWh) / 2; usage effect = (state kWh – US kWh) x (state price + US price) / 2. Effects sum to the gap. Ranked by bill.
Source: [1] U.S. Energy Information Administration
Usage tracks heating and cooling. In EIA RECS 2020, 34% of US homes used electricity as their main heating fuel; across states that share correlates at 0.84 with 2025 monthly usage. Florida (66% electric heat, 1,103 kWh) and Alabama (64%, 1,145 kWh) sit at one end, California (20%, 494 kWh) at the other.
Price differences have structural causes that EIA documents. EIA Electricity Explained states that Hawaii's prices are high mainly because most of its electricity is generated with imported petroleum fuels, and that prices reflect fuel, power plant, transmission and distribution costs, weather and regulation. Lawrence Berkeley National Laboratory found higher gas and wholesale prices drove 2024 to 2025 retail changes in 21 states and distribution costs in 22.
Price effect and usage effect: The price effect is the part of a state's bill gap that comes from paying a different price per kWh than the US average; the usage effect is the part that comes from using a different number of kWh. Both are in dollars per month.
What higher bills mean for load, efficiency and solar quotes
Bills shape what homeowners ask electricians to price: heat pump and water heater swaps in high-usage states, solar and batteries in high-price states. The data shows where each pressure is strongest.
At the August 2026 US average price, every 100 kWh of added load costs about $18.16 a month before any rate-design effects; at Hawaii's 47.18 cents the same load costs $47.18. This is simple arithmetic on the average price, which already includes fixed charges.
Rooftop solar concentrates where prices are high. EIA-861 counted 5,513,622 residential net-metered solar installations in 2025, 38.1 per 1,000 residential customers nationally. Hawaii had 232.3 per 1,000 and California 156.0; across states, installations per customer correlate at 0.64 with the 2025 residential price. Residential PV-paired batteries totalled 431,825.
Show all 52 rows
| State | Average monthly bill 2025 ($) | Average monthly use 2025 (kWh) | Homes with electricity as main heating fuel, 2020 (%) | Residential net-metered solar PV installations, 2025 | Per 1,000 residential customers | Residential PV-paired battery installations, 2025 |
|---|---|---|---|---|---|---|
| Hawaii | 207.89 | 515 | 5 | 104,259 | 232.3 | 20,472 |
| California | 154.73 | 494 | 20 | 2,241,381 | 156.0 | 328,492 |
| Nevada | 115.07 | 868 | 23 | 142,497 | 106.7 | 3,639 |
| Arizona | 157.15 | 1,030 | 51 | 333,870 | 104.2 | 17,747 |
| Connecticut | 206.46 | 704 | 19 | 119,508 | 75.6 | 46 |
| Colorado | 103.30 | 658 | 16 | 191,943 | 73.8 | 1,712 |
| Massachusetts | 181.08 | 596 | 17 | 209,993 | 71.9 | 2,674 |
| New Mexico | 94.65 | 638 | 13 | 64,532 | 68.2 | 133 |
| District of Columbia | 140.05 | 639 | 41 | 21,479 | 66.1 | 0 |
| Utah | 99.06 | 761 | 13 | 86,164 | 66.0 | 12,308 |
| New Jersey | 150.59 | 670 | 16 | 219,395 | 58.0 | 2,803 |
| Maryland | 184.42 | 944 | 41 | 118,789 | 48.1 | 753 |
| Rhode Island | 165.62 | 562 | 13 | 19,998 | 43.0 | 1,406 |
| New Hampshire | 156.94 | 640 | 9 | 25,210 | 38.3 | 777 |
| New York | 154.75 | 586 | 16 | 251,828 | 33.7 | 4,786 |
| Oregon | 133.89 | 866 | 45 | 61,540 | 32.6 | 2,459 |
| Delaware | 157.80 | 920 | 40 | 15,186 | 31.5 | 41 |
| Vermont | 134.78 | 591 | 6 | 9,399 | 29.9 | 0 |
| Florida | 167.86 | 1,103 | 66 | 319,411 | 29.9 | 5,292 |
| Idaho | 110.36 | 933 | 26 | 23,850 | 26.9 | 704 |
| Maine | 147.67 | 533 | 10 | 18,997 | 25.4 | 114 |
| Montana | 110.80 | 853 | 24 | 12,536 | 22.2 | 395 |
| Illinois | 126.59 | 716 | 17 | 119,442 | 22.0 | 30 |
| Virginia | 163.05 | 1,067 | 50 | 74,360 | 20.2 | 901 |
| Washington | 124.41 | 945 | 55 | 66,257 | 19.4 | 3,888 |
| Pennsylvania | 161.90 | 839 | 26 | 93,934 | 16.9 | 1,482 |
| Louisiana | 153.32 | 1,225 | 62 | 35,971 | 16.7 | 4 |
| South Carolina | 161.21 | 1,066 | 64 | 41,365 | 15.7 | 1,100 |
| Iowa | 117.30 | 861 | 16 | 19,220 | 13.2 | 23 |
| Arkansas | 138.42 | 1,076 | 46 | 19,458 | 13.1 | 46 |
| North Carolina | 146.14 | 1,044 | 62 | 63,841 | 12.4 | 430 |
| Wyoming | 111.59 | 835 | 18 | 3,547 | 12.1 | 190 |
| Missouri | 137.97 | 1,037 | 31 | 33,251 | 11.3 | 827 |
| Texas | 170.95 | 1,110 | 51 | 138,081 | 10.8 | 5,395 |
| Minnesota | 117.67 | 743 | 14 | 26,695 | 10.2 | 129 |
| Alaska | 147.18 | 564 | 13 | 3,005 | 10.0 | 0 |
| Oklahoma | 140.52 | 1,064 | 39 | 18,196 | 9.6 | 437 |
| Wisconsin | 120.60 | 667 | 14 | 21,545 | 7.5 | 800 |
| Kansas | 126.42 | 876 | 21 | 9,805 | 7.4 | 2 |
| Ohio | 147.74 | 874 | 23 | 33,206 | 6.4 | 1,943 |
| Michigan | 127.17 | 635 | 10 | 26,849 | 5.9 | 4,884 |
| West Virginia | 165.13 | 1,073 | 45 | 4,841 | 5.6 | 724 |
| Kentucky | 143.72 | 1,094 | 49 | 10,993 | 5.3 | 564 |
| Georgia | 158.70 | 1,077 | 46 | 20,377 | 4.2 | 491 |
| Indiana | 149.72 | 938 | 26 | 11,490 | 3.7 | 718 |
| Nebraska | 117.23 | 973 | 24 | 3,256 | 3.6 | 14 |
| Mississippi | 166.05 | 1,184 | 56 | 2,029 | 1.5 | 11 |
| South Dakota | 131.10 | 984 | 25 | 570 | 1.3 | 0 |
| North Dakota | 126.40 | 1,070 | 34 | 89 | 0.2 | 0 |
| Alabama | 184.31 | 1,145 | 64 | 87 | 0.0 | 0 |
| Tennessee | 156.03 | 1,180 | 60 | 97 | 0.0 | 39 |
| United States | 150.68 | 874 | 34 | 5,513,622 | 38.1 | 431,825 |
Electric heating share from RECS 2020 (survey estimate). Solar and battery counts are residential net-metered installations reported on EIA-861 for 2025. Ranked by solar installations per 1,000 residential customers.
Source: [1][15][16] U.S. Energy Information Administration; U.S. Energy Information Administration; U.S. Energy Information Administration
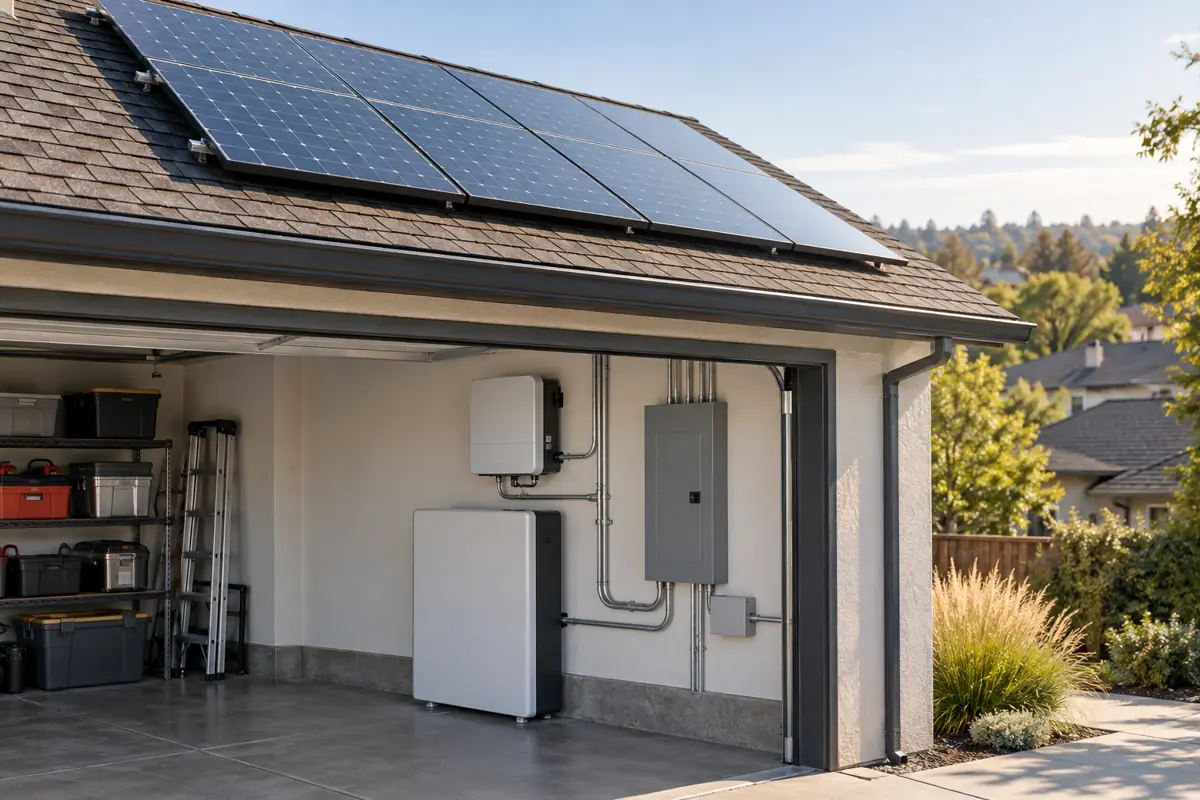
Related site data: installed costs for panel upgrades and EV charger installation, and reliability by state in power outages by state. Labor rates are on the pricing pages, and homeowners can find licensed contractors through hire an electrician.
The math behind the moves
Average monthly residential bill by state, 2025
FormulaEIA published bill (revenue / customers / 12); checked as revenue / customers / 12 from EIA-861M annual rows
Inputs: state fact rows (bill, kWh, price 2025); derived d1 to d10 (fact sheet rows)
Result: US $150.68; range $94.65 (New Mexico) to $207.89 (Hawaii); ratio 2.2
The EIA-861M recomputation reproduces EIA's published US bill exactly ($150.68).
Limitations: Per customer account, not per household; includes vacation homes and small accounts; annual average hides seasonal peaks.
12-month change in residential price by state
Formula(August 2026 / August 2025 - 1) x 100, and the same for January to August year to date
Inputs: state fact rows a26, a25, y26, y25; derived d15 to d23 (fact sheet rows)
Result: US 3.4% (August), 6.8% (YTD); 44 up and 7 down in August; 48 up and 3 down YTD
Year-to-date changes are steadier and point to broad increases; single-month changes swing widely in small states.
Limitations: 2026 values are preliminary; price is average revenue per kWh, so changes in usage mix can move it.
Price and usage decomposition of each state's bill gap
Formulaprice effect = (p_s - p_US)(q_s + q_US)/2; usage effect = (q_s - q_US)(p_s + p_US)/2
Inputs: state rows b25, q25, p25; US rows; derived d24 to d31 (fact sheet rows)
Result: Price larger in 28, usage larger in 23; opposite signs in 40
High-price states tend to use less, which narrows bill gaps; the biggest bills come from price in the Northeast and Hawaii and from usage in the South.
Limitations: Gaps measured against the US average only; uses rounded EIA components; describes, does not explain causes such as climate or housing stock.
Cumulative US residential price change since 2020 vs CPI-U
Formula(price 2025 / price 2020 - 1) x 100 vs (CPI 2025 / CPI 2020 - 1) x 100; real = ratio / ratio - 1
Inputs: fact rows annual price 2020 and 2025, CPI 2020 and 2025; derived d34 to d42 (fact sheet rows)
Result: 31.0% vs 24.4% (real 5.3%); August to August 2020 to 2026: 37.0% vs 28.9% (real 6.3%)
Residential electricity outpaced general inflation since 2020, though by less than the nominal headlines suggest.
Limitations: CPI 2025 annual average excludes the uncollected October 2025 month; base-year choice matters (2020 prices were low).
Electric heating, solar adoption and price across states
FormulaPearson correlation across 51 jurisdictions
Inputs: state rows h, q25, pv, p25; derived d31 to d33 (fact sheet rows)
Result: electric heat share vs usage r = 0.84; solar per 1,000 customers vs price r = 0.64
Usage differences line up with how homes are heated; solar uptake lines up with high prices.
Limitations: Correlation only; RECS is 2020; solar counts are net-metered systems and reflect state policy as well as price.
Numbers to watch
- The average US residential electric bill was $150.68 a month in 2025, or about $1,808 a year per customer account (EIA-861, United States).[1]
- The US average bill rose $8.42 a month, or 5.9%, from 2024 to 2025; the average price rose 4.6% and average usage rose 1.3% (EIA-861, United States).[1][2]
- The average bill rose from 2024 to 2025 in 47 of 51 jurisdictions; the largest increase was in the District of Columbia (23.7%) and the largest fall in Nevada (-17.4%) (EIA-861).[1][2]
- Hawaii had the highest 2025 bill ($207.89) and the highest 2025 residential price (40.40 cents per kWh) of any state (EIA-861).[1]
- New Mexico had the lowest 2025 bill at $94.65 a month, 2.2 times less than Hawaii's; Utah ($99.06) and Colorado ($103.30) followed (EIA-861).[1]
- North Dakota had the lowest 2025 residential price at 11.82 cents per kWh, just below Idaho at 11.83 cents (EIA-861).[1]
- Louisiana homes used the most electricity in 2025, 1,225 kWh a month on average; California used the least, 494 kWh (EIA-861).[1]
- From January to August 2026 the US residential price averaged 18.19 cents per kWh, 6.8% above the same period of 2025 (EIA Electric Power Monthly, preliminary).[4]
- The District of Columbia had the largest year-to-date residential price rise to August 2026, 17.2%, followed by New Hampshire (15.0%) and Hawaii (14.7%) (EIA Table 5.6.B).[4]
- Only 3 jurisdictions had a lower residential price in January to August 2026 than a year earlier: Connecticut (-9.1%), Massachusetts and Rhode Island (each -0.1%) (EIA Table 5.6.B).[4]
- Across the 50 states and DC in 2025, the residential price and average usage were strongly negatively correlated (r = -0.81 on logs): high-price states use less electricity (Data Desk calculation from EIA-861).[1]
- Price is the larger driver of the bill gap from the US average in 28 jurisdictions; usage is larger in 23, including Alabama, Florida, Georgia, Louisiana, Mississippi, Tennessee and Texas (Data Desk decomposition of EIA-861 2025).[1]
- States with a higher share of homes heated by electricity used more electricity per customer: r = 0.84 between the 2020 RECS electric-heat share and 2025 monthly usage (EIA RECS, EIA-861).[1][15]
- The US residential price rose 31.0% from 2020 to 2025, against 24.4% for CPI-U all items, a 5.3% real increase (EIA, BLS).[8][9]
- Residential net-metered solar installations reached 5,513,622 in 2025, or 38.1 per 1,000 residential customers; Hawaii led at 232.3 per 1,000 (EIA-861 net metering).[16][1]
In short
- The average US residential electric bill was $150.68 a month in 2025, up 5.9% from $142.26 in 2024, according to final EIA-861 data released October 7, 2026.
- US homes used an average of 874 kWh a month in 2025 and paid an average of 17.23 cents per kWh (EIA-861).
- Hawaii had the highest average bill in 2025 at $207.89 a month, followed by Connecticut at $206.46; New Mexico had the lowest at $94.65.
- The US residential price averaged 18.19 cents per kWh from January to August 2026, 6.8% above the same months of 2025; prices rose in 48 of 51 jurisdictions (EIA Electric Power Monthly, preliminary).
- In August 2026 alone the US residential price was 18.16 cents, 3.4% above August 2025; Hawaii rose 22.5% and Connecticut fell 18.8%.
- Splitting each state's 2025 bill gap from the US average shows price is the larger driver in 28 jurisdictions and usage in 23; in 40 the two effects pull in opposite directions.
- From 2020 to 2025 the US residential price rose 31.0% while CPI-U all items rose 24.4%, a real increase of 5.3% (EIA, BLS).
- EIA's October 2026 outlook forecasts an average residential price of 18.21 cents per kWh for 2026 and 18.68 cents for 2027 (forecasts).
What people search for
How much is the average electric bill per month?
The average US residential electric bill was $150.68 a month in 2025, for 874 kWh at 17.23 cents per kWh, according to final EIA-861 data. A Data Desk average of EIA-861M monthly data for September 2025 to August 2026 gives $157.80 (preliminary).
Which state has the highest electric bill?
Hawaii, at $207.89 a month in 2025, followed by Connecticut at $206.46 and Maryland at $184.42 (EIA-861). Hawaii's gap is a price effect: it paid 40.40 cents per kWh but used only 515 kWh a month.
Which state has the cheapest electricity?
By price, North Dakota had the lowest 2025 residential rate at 11.82 cents per kWh, with Idaho at 11.83 cents (EIA-861). By bill, New Mexico was lowest at $94.65 a month. In August 2026, Nevada had the lowest monthly residential price at 12.72 cents (preliminary).
Why are electricity prices rising?
EIA's October 2026 outlook cites higher wholesale prices after winter storm Fern and a hot July, and says residential prices also include transmission and distribution upgrades and capacity market auction prices in some regions. EIA forecasts wholesale prices across 11 hubs 11% above 2025 in 2026 and PJM up 41%.
What is the average cost of electricity per kWh?
The US average residential price was 17.23 cents per kWh in 2025 (EIA-861) and 18.16 cents in August 2026 (preliminary). It averaged 18.19 cents from January to August 2026 (EIA Electric Power Monthly).
Common questions
What is the average electric bill in the US?
$150.68 a month in 2025 for residential customers, up from $142.26 in 2024 (EIA-861, United States).
What is the average electric bill per year?
About $1,808 per residential customer account in 2025, which is the 2025 monthly average of $150.68 times 12 (EIA-861).
How much electricity does the average home use per month?
874 kWh a month in 2025 (EIA-861). EIA's FAQ page still cites 2022 data (10,791 kWh a year), so the newer figure is used here.
Which states have the highest electricity rates?
In 2025 Hawaii (40.40 cents per kWh), California (31.35), Massachusetts (30.41), Rhode Island (29.48) and Connecticut (29.31) had the highest residential prices (EIA-861).
Which state has the lowest electric bill?
New Mexico, at $94.65 a month in 2025, then Utah at $99.06 and Colorado at $103.30 (EIA-861).
How much did electricity prices go up in 2026?
From January to August 2026 the US residential price averaged 18.19 cents per kWh, 6.8% above the same months of 2025 (EIA, preliminary).
Are electricity prices rising faster than inflation?
Yes since 2020: the US residential price rose 31.0% from 2020 to 2025 while CPI-U rose 24.4%, a real rise of 5.3% (EIA, BLS). In the 12 months to August 2026 the BLS electricity index rose 3.8% and CPI-U 3.4%.
Why is Hawaii's electric bill so high?
Its price of 40.40 cents per kWh in 2025 was the highest in the US; EIA says most Hawaii electricity is generated with imported petroleum fuels. Low usage of 515 kWh a month offsets part of the gap.
Why do Southern states have high bills despite cheap power?
Usage. Louisiana homes used 1,225 kWh a month in 2025 at 12.52 cents, and Alabama 1,145 kWh; 64% of Alabama homes heat with electricity (EIA-861, RECS 2020).
Will electricity prices keep going up?
EIA's October 2026 outlook forecasts 18.21 cents per kWh for 2026 and 18.68 cents for 2027, a further 2.6% rise. Forecasts are revised monthly.
Get the data
Every table in this report is available as a CSV under CC BY 4.0. The fact sheet lists each value with its source URL and access date.
- derived_metrics.csv (CSV)
- fact_sheet.csv (CSV)
- US average residential electricity price, bill and usage, 2015 to 2025 (CSV)
- Average monthly residential electric bill by state, 2025 (ranked), with 2024 comparison (CSV)
- Residential electricity price by state: 12-month change to August 2026 and year-to-date change (CSV)
- Price effect and usage effect on each state's bill gap from the US average, 2025 (CSV)
- US residential electricity price vs consumer price inflation since 2020 (CSV)
- Bills, usage, electric heating and rooftop solar by state (CSV)
Cite this report
The figures to cite first
- US average residential electric bill: $150.68 a month in 2025 (EIA-861 final, released October 7, 2026).[1]
- US residential price, January to August 2026: 18.19 cents per kWh, up 6.8% year on year (EIA, preliminary).[4]
- State bill gaps: price is the larger driver in 28 jurisdictions, usage in 23 (Data Desk decomposition of EIA-861 2025).[1]
Quotable figures
- The average US residential electric bill was $150.68 a month in 2025, up 5.9% from 2024 (EIA-861).[1][2]
- Hawaii had the highest average electric bill in 2025 at $207.89 a month; New Mexico had the lowest at $94.65.[1]
- US residential electricity prices from January to August 2026 were 6.8% above the same period of 2025, and rose in 48 of 51 jurisdictions.[4]
- From 2020 to 2025 the US residential price rose 31.0%, against 24.4% for consumer prices in general.[8][9]
- Price, not usage, is the larger reason a state's bill differs from the US average in 28 of 51 jurisdictions.[1]
- Louisiana homes used 1,225 kWh a month in 2025, more than twice California's 494 kWh.[1]
Summary for editors
The average US residential electric bill was $150.68 a month in 2025, up 5.9% from $142.26 in 2024, according to an analysis of final Energy Information Administration data by the Electrical Contractors and Wiring Data Desk. Bills ranged from $94.65 in New Mexico to $207.89 in Hawaii. Prices kept rising in 2026: the US residential price averaged 18.19 cents per kWh from January to August, 6.8% above a year earlier, with increases in 48 of 51 jurisdictions and the largest in the District of Columbia (17.2%). Splitting each state's gap from the national bill into a price effect and a usage effect shows price is the larger driver in 28 jurisdictions and usage in 23; high-price states tend to use less electricity. Since 2020 the residential price has risen 31.0%, against 24.4% for consumer prices. EIA forecasts 18.21 cents per kWh for 2026.
Headlines the data supports
- Average electric bill hits $150.68 a month, up 5.9% in a year
- Hawaii and Connecticut electric bills top $200 a month
- Electricity prices up 6.8% in 2026 so far, rising in 48 of 51 jurisdictions
- Price, not usage: why your state's electric bill is higher than average
- Home electricity prices rose 31.0% since 2020, outpacing 24.4% inflation
Citation
Electrical Contractors and Wiring. (2026). Average Electric Bill by State: 2025 Bills, 2026 Price Changes and What Drives the Gap. Retrieved from https://electricalcontractorsandwiring.com/data/average-electric-bill-by-state/
Reuse
Data and tables are licensed CC BY 4.0. Attribution: “Source: Electrical Contractors and Wiring, Average Electric Bill by State: 2025 Bills, 2026 Price Changes and What Drives the Gap” with a link to this page.
How we built this report
Selection: the state bill is EIA's own published residential average monthly bill from the final 2025 EIA-861 data files (Average_Bill_2025.xlsx, released October 7, 2026), the latest complete annual release. The 2024 comparison uses EIA's 2024 Table 5A. Monthly and year-to-date state prices come from Electric Power Monthly Tables 5.6.A and 5.6.B for August 2026 (released October 23, 2026), the latest month. The national monthly series comes from the EIA-861M sales and revenue file. Inflation uses BLS CPI-U flat files (series CUUR0000SA0 and CUUR0000SEHF01) through September 2026.
Inclusion and exclusion: only federal statistical files, an EIA forecast and a Department of Energy national laboratory report were used for figures. Commercial comparison pages were opened only to benchmark this report and none of their figures is used as a finding. Commercial and industrial prices, including the commercial price on this site's homepage, are excluded.
Conflicts: EIA publishes slightly different 2025 residential prices in different products: 17.23 cents in EIA-861 and EPM final data, and 17.30 cents in the October 2026 STEO table and the Electricity Explained page, which cites February 2026 preliminary data. This report uses the final 17.23 cents and labels 17.30 where quoted. The EIA-861M recomputation of the 2025 US bill matches EIA's published bill to the cent.
Derived metrics: bill change, 12-month and year-to-date price changes, the rolling 12-month bill, the midpoint price and usage decomposition, cross-state correlations and real price changes are all computed in scripts/build_data.py from raw files and listed in derived_metrics.csv with formulas and inputs. The decomposition uses EIA's rounded price and consumption, so price times usage can differ from the published bill by a few cents.
Limitations: the bill is average revenue per residential account, which mixes year-round homes, apartments and seasonal accounts; it is not the bill of a typical household on a specific tariff. Single-month prices are volatile and 2026 values are preliminary. RECS heating shares are from 2020. Solar counts cover net-metered systems only. BLS did not collect October 2025 CPI data because of the 2025 lapse in appropriations.
Last updated 2026-10-27. Next scheduled inputs: Electric Power Monthly with September 2026 data on 2026-11-24, STEO on 2026-11-10, CPI for October 2026 on 2026-11-10.
This report presents published data with its limitations. It is not legal, financial or investment advice.
Sources by tier
Tier 1: primary and official sources (19)
- [1] U.S. Energy Information Administration. Annual Electric Power Industry Report (EIA-861), 2025 final data: Average Monthly Bill, Residential. 2025. Accessed 2026-10-27.
- [2] U.S. Energy Information Administration. Electric Sales, Revenue, and Average Price 2024, Table 5A: Residential average monthly bill. 2024. Accessed 2026-10-27.
- [3] U.S. Energy Information Administration. Electric Power Monthly, Table 5.6.A: Average price by state, August 2026 and 2025. Aug 2025, Aug 2026. Accessed 2026-10-27.
- [4] U.S. Energy Information Administration. Electric Power Monthly, Table 5.6.B: Average price by state, year to date through August 2026 and 2025. Jan to Aug 2025 and 2026. Accessed 2026-10-27.
- [5] U.S. Energy Information Administration. Electric Power Monthly, Table 5.3: Average price by sector, 2016 to August 2026. 2016 to Aug 2026. Accessed 2026-10-27.
- [6] U.S. Energy Information Administration. Electric Power Monthly (data for August 2026, released October 23, 2026). Aug 2026. Accessed 2026-10-27.
- [7] U.S. Energy Information Administration. EIA-861 detailed data files page (release dates). 2025. Accessed 2026-10-27.
- [8] U.S. Energy Information Administration. Form EIA-861M sales and revenue data, sales_revenue.xlsx. 2010 to Aug 2026. Accessed 2026-10-27.
- [9] U.S. Bureau of Labor Statistics. Consumer Price Index flat file cu.data.1.AllItems (CPI-U all items, CUUR0000SA0) and footnotes. 1913 to Sep 2026. Accessed 2026-10-27.
- [10] U.S. Bureau of Labor Statistics. Consumer Price Index flat file cu.data.12.USHousing (CPI-U electricity, CUUR0000SEHF01). to Sep 2026. Accessed 2026-10-27.
- [11] U.S. Bureau of Labor Statistics. Schedule of releases for the Consumer Price Index. 2026 to 2027. Accessed 2026-10-27.
- [12] U.S. Energy Information Administration. Short-Term Energy Outlook, October 2026: Electricity, coal, and renewables. 2024 to 2027 (forecast). Accessed 2026-10-27.
- [13] U.S. Energy Information Administration. Short-Term Energy Outlook, October 2026, full report (Tables 7a and 7c). 2024 to 2027 (forecast). Accessed 2026-10-27.
- [14] U.S. Energy Information Administration. Electricity explained: Prices and factors affecting prices. 2025. Accessed 2026-10-27.
- [15] U.S. Energy Information Administration. Residential Energy Consumption Survey 2020: State space heating fuels. 2020. Accessed 2026-10-27.
- [16] U.S. Energy Information Administration. EIA-861 2025 final data: Net metering, state level. 2025. Accessed 2026-10-27.
- [17] Lawrence Berkeley National Laboratory and The Brattle Group. Retail Electricity Price Trends and Drivers: Data Update, 2026 Edition (July 2026 update). 2010 to 2025. Accessed 2026-10-27.
- [18] U.S. Energy Information Administration. Electric Power Annual (data for 2025, released October 21, 2026). 2025. Accessed 2026-10-27.
- [19] U.S. Energy Information Administration. FAQ: How much electricity does an American home use?. 2022. Accessed 2026-10-27.
Tier 3: journalism and expert commentary (3)
- [20] ElectricityPlans. Average Electricity Bill, Usage and Price per kWh by State (October 2026). Jul 2026. Accessed 2026-10-27.
- [21] HomeSnacks. Average Electric Bill By State In The United States For 2026. 2024. Accessed 2026-10-27.
- [22] EnergyBot. Average Electricity Bills in Every State. not stated. Accessed 2026-10-27.