Data center power consumption in the US: official estimates, state sales and grid forecasts
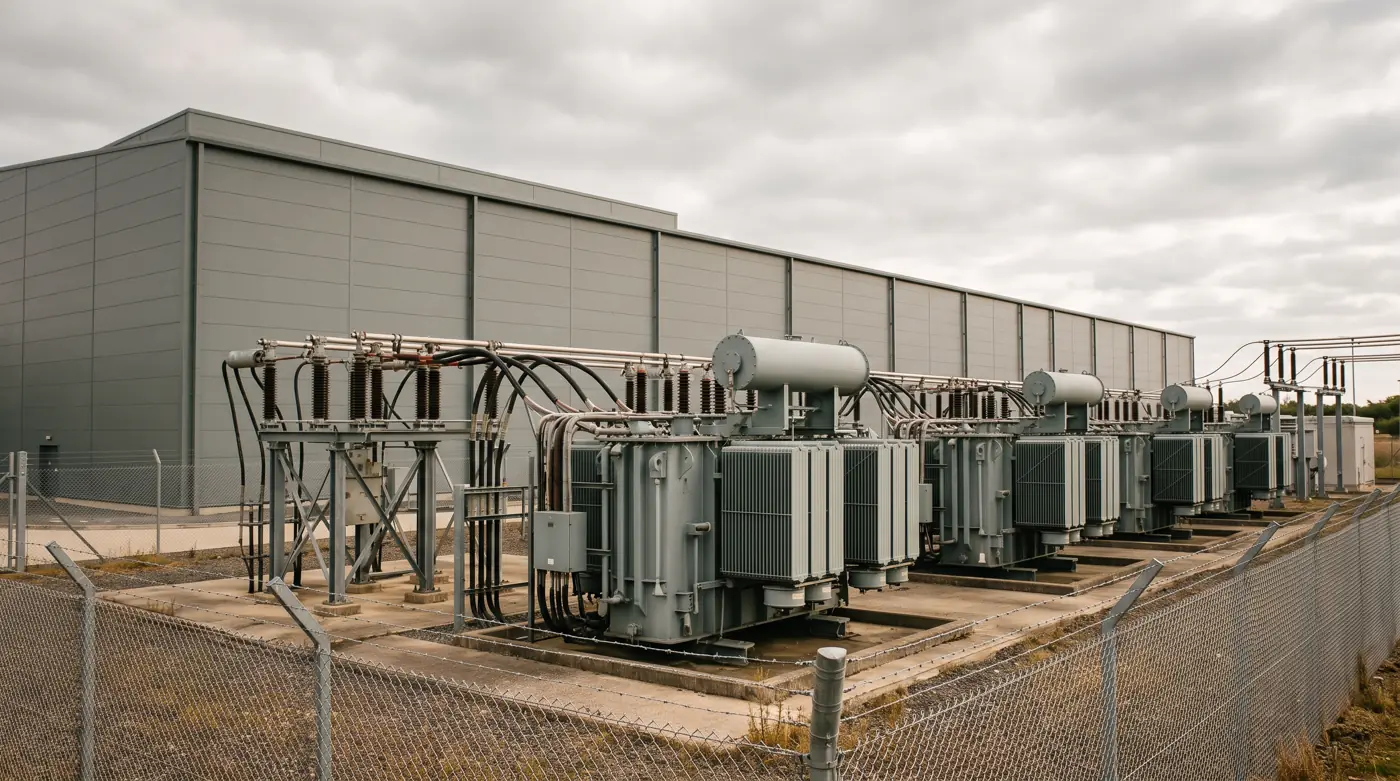
- Data
- LBNL 2025 Update (June 2026); EIA Form EIA-861M state sales (August 2026 data)
- Period
- Estimates 2014 to 2024, forecasts to 2030 and beyond; sales January 2019 to August 2026
- Release used
- 2026-10-23
- Next release
- End of November 2026 (EIA-861M, September 2026 data)
- Geography
- United States, 50 states and DC, ERCOT, PJM, Dominion and Georgia Power service areas
- Sources
- 32 (26 official)
US data center power consumption reached an estimated 192 TWh in 2024, or 4.7% of all US electricity, according to the Lawrence Berkeley National Laboratory update published in June 2026. Its Reference Case reaches 649 TWh (11.8%) by 2030. Measured commercial electricity sales rose 176.0 TWh between 2019 and the 12 months to August 2026, led by Texas and Virginia.
Data center power consumption estimates: 176 TWh in 2023, 192 TWh in 2024
Every national figure for US data center electricity use is a model estimate. Lawrence Berkeley National Laboratory's bottom-up model, funded by DOE, is the federal reference; its June 2026 update raised the near-term outlook and moved the horizon to 2030.
LBNL's 2025 Update estimates US data center electricity use at 192 TWh in 2024, 4.7% of total US electricity consumption (LBNL 2025 Update). The figure excludes cryptocurrency mining. LBNL treats 2024 as the last historical year because its server shipment data run only through the first three quarters of 2025.
The earlier December 2024 report put 2023 use at 176 TWh, 4.4% of US consumption, up from 76 TWh (1.9%) in 2018 and about 60 TWh a year in 2014 to 2016 (LBNL 2024 report). DOE's release for that report gave 58 TWh for 2014 (DOE). The 2025 Update revised earlier years slightly downward after lower reported GPU shipments for 2023 and 2024.
| Publisher and report | Published | Year covered | Type | Electricity (TWh) | Share of U.S. electricity | Method |
|---|---|---|---|---|---|---|
| Brown et al., report to Congress (cited by LBNL 2024) | 2007 | 2006 | Historical estimate | 61 | 1.5% | Bottom-up model |
| Shehabi et al., LBNL (cited by LBNL 2024) | 2016 | 2014 | Historical estimate | 70 | 1.8% | Bottom-up model |
| LBNL 2024 report, as summarised by DOE | Dec 2024 | 2014 | Historical estimate | 58 | not stated | Bottom-up model |
| LBNL 2024 report | Dec 2024 | 2018 | Historical estimate | 76 | 1.9% | Bottom-up model |
| LBNL 2024 report | Dec 2024 | 2023 | Historical estimate | 176 | 4.4% | Bottom-up model |
| LBNL 2024 report, low scenario | Dec 2024 | 2028 | Forecast | 325 | 6.7% | Scenario range |
| LBNL 2024 report, high scenario | Dec 2024 | 2028 | Forecast | 580 | 12.0% | Scenario range |
| IEA Energy and AI (derived: 45% of 415 TWh) | 2025 | 2024 | Historical estimate | 186.8 | not stated | IEA model; U.S. share of global total |
| IEA Energy and AI, Base Case (derived: 2024 plus 240 TWh) | 2025 | 2030 | Forecast | 426.8 | not stated | IEA scenario |
| LBNL 2025 Update | Jun 2026 | 2024 | Historical estimate | 192 | 4.7% | Bottom-up model, revised shipments |
| LBNL 2025 Update, Reference Case | Jun 2026 | 2028 | Forecast | 464 | not stated | Bottom-up scenario |
| LBNL 2025 Update, Reference Case | Jun 2026 | 2030 | Forecast | 649 | 11.8% | Bottom-up scenario |
| LBNL 2025 Update, Compounded Uncertainty low | Jun 2026 | 2030 | Forecast | 521 | 9.5% | Bottom-up scenario |
| LBNL 2025 Update, Compounded Uncertainty high | Jun 2026 | 2030 | Forecast | 843 | 15.3% | Bottom-up scenario |
| EPRI 2026, as cited by LBNL 2025 Update (Tier 2) | 2026 | 2030 | Forecast | 390 to 800 | not stated | Scenario range |
Historical values are model estimates, not metered data. IEA rows are derived from IEA shares; EPRI is quoted by LBNL. Shares use each publisher's own US total.
Source: [1][3][4][13][14] Lawrence Berkeley National Laboratory for the U.S. Department of Energy; Lawrence Berkeley National Laboratory for the U.S. Department of Energy; U.S. Department of Energy; International Energy Agency; International Energy Agency
TWh; 2014 to 2024 are model estimates, 2028 and 2030 are Reference Case forecasts
Source: LBNL 2024 report (2018, 2023) and 2025 Update (2024, 2028, 2030); DOE release (2014)
LBNL's Reference Case grows 22% from 2024 to 2025 and 29% from 2025 to 2026, then at a compound annual rate of 21% to 649 TWh in 2030. Applying those rates to 192 TWh gives about 234.2 TWh for 2025 and 302.2 TWh for 2026 (derived). The 2028 Reference Case of 464 TWh sits close to the 452.5 TWh midpoint of the 2024 report's 2028 range.
| Scenario (LBNL 2025 Update) | 2030 electricity (TWh) | Difference from Reference Case | Share of 2030 U.S. electricity |
|---|---|---|---|
| Reference Case | 649 | none | 11.8% |
| Consolidated Deployment | 578 | -10.8% | 10.5% |
| High ASIC | 664 | +2.4% | 12.1% |
| Low Accelerator Lifetime | 590 | -9.1% | 10.7% |
| High Inference Energy | 782 | +20.6% | 14.2% |
| Compounded Uncertainty, low | 521 | -19.6% | 9.5% |
| Compounded Uncertainty, high | 843 | +29.9% | 15.3% |
Share of 2030 US electricity uses NERC's 2025 LTRA forecast as the denominator.
Source: [1] Lawrence Berkeley National Laboratory for the U.S. Department of Energy
TWh and GW: A terawatt-hour (TWh) is one billion kilowatt-hours of energy used over a period. A gigawatt (GW) is a rate of power draw. LBNL's 192 TWh for 2024 equals an average draw of about 21.9 GW across the year (derived: 192 TWh divided by 8,760 hours).
Commercial electricity sales rose 176.0 TWh since 2019, led by Texas and Virginia
Measured sales do not isolate data centers, but the states with large data center clusters lead national growth in commercial-sector electricity sales. EIA itself attributes Virginia's growth largely to data centers.
US commercial-sector retail electricity sales were 1,360.9 TWh in 2019 and 1,536.9 TWh in the 12 months from September 2025 to August 2026, a rise of 176.0 TWh or 12.9% (EIA-861M). Total retail sales across all sectors rose 311.8 TWh (8.2%) over the same span, so the commercial sector supplied 56.5% of the increase.
Texas added 42.2 TWh of commercial sales and Virginia added 34.2 TWh. Together they account for 43.4% of the national commercial increase. Virginia's commercial sales rose 63.3%, from 54.0 TWh to 88.2 TWh. Fourteen of the 51 jurisdictions (50 states and DC) sold less commercial electricity in the latest 12 months than in 2019.
| Rank | State | Commercial sales 2019 (TWh) | Commercial sales Sep 2025 to Aug 2026 (TWh) | Change (TWh) | Change (%) | Total retail sales change (%) | Named as data center state in brief |
|---|---|---|---|---|---|---|---|
| 1 | Texas | 142.0 | 184.2 | +42.2 | +29.7% | +24.4% | yes |
| 2 | Virginia | 54.0 | 88.2 | +34.2 | +63.3% | +26.0% | yes |
| 3 | Ohio | 46.0 | 63.2 | +17.2 | +37.3% | +12.6% | yes |
| 4 | Georgia | 47.4 | 59.7 | +12.3 | +25.9% | +12.3% | yes |
| 5 | Arizona | 29.4 | 41.2 | +11.8 | +40.0% | +24.9% | yes |
| 6 | Oregon | 16.4 | 28.2 | +11.7 | +71.5% | +23.6% | yes |
| 7 | Oklahoma | 20.1 | 28.3 | +8.2 | +40.7% | +16.5% | no |
| 8 | Nebraska | 9.5 | 16.8 | +7.3 | +77.4% | +30.6% | no |
| 9 | Florida | 96.6 | 101.8 | +5.2 | +5.4% | +8.5% | no |
| 10 | South Carolina | 22.2 | 27.4 | +5.2 | +23.5% | +8.1% | no |
| 11 | Washington | 29.3 | 33.9 | +4.6 | +15.9% | -1.1% | no |
| 12 | Indiana | 23.5 | 28.0 | +4.4 | +18.9% | +3.8% | no |
| 13 | North Dakota | 7.0 | 11.5 | +4.4 | +62.9% | +40.8% | no |
| 14 | Utah | 11.9 | 15.5 | +3.6 | +30.8% | +16.5% | no |
| 15 | Nevada | 11.7 | 14.9 | +3.3 | +27.9% | +12.2% | no |
| 16 | Wyoming | 3.6 | 5.9 | +2.3 | +65.1% | +4.8% | no |
| 17 | North Carolina | 49.2 | 51.0 | +1.8 | +3.6% | +4.1% | no |
| 18 | Iowa | 12.3 | 13.6 | +1.3 | +10.5% | +18.3% | yes |
| 19 | Kentucky | 19.6 | 20.6 | +1.0 | +5.2% | +0.5% | no |
| 20 | Missouri | 30.1 | 31.1 | +1.0 | +3.2% | +2.5% | no |
| United States (50 states and DC) | 1,360.9 | 1,536.9 | +176.0 | +12.9% | +8.2% |
Latest 12 months is September 2025 to August 2026; January to August 2026 are preliminary. 'Named as data center state' follows the seven states listed in this report's brief, not an EIA classification. The full 51-row file is in scripts/state_sales_all_states.csv.
Source: [5][6] U.S. Energy Information Administration; U.S. Energy Information Administration
Change in TWh, calendar 2019 to September 2025 through August 2026; top 15 states
Source: U.S. EIA, Form EIA-861M sales and revenue file (August 2026 release, 2026 months preliminary)
Calendar 2019 versus September 2025 through August 2026
Source: U.S. EIA, Form EIA-861M (August 2026 release)
EIA's May 2026 analysis says Virginia's commercial sales grew by nearly 30.0 million MWh between 2019 and 2025, largely driven by data centers, with electric vehicles and building electrification also contributing (EIA Today in Energy). This report's calendar 2025 figure from the later EIA-861M file is 32.6 TWh; EIA's article used February 2026 preliminary data. In June 2024 EIA linked Texas growth to data centers and cryptocurrency mining, and North Dakota's 37% rise from 2019 to 2023 to large computing facilities (EIA).
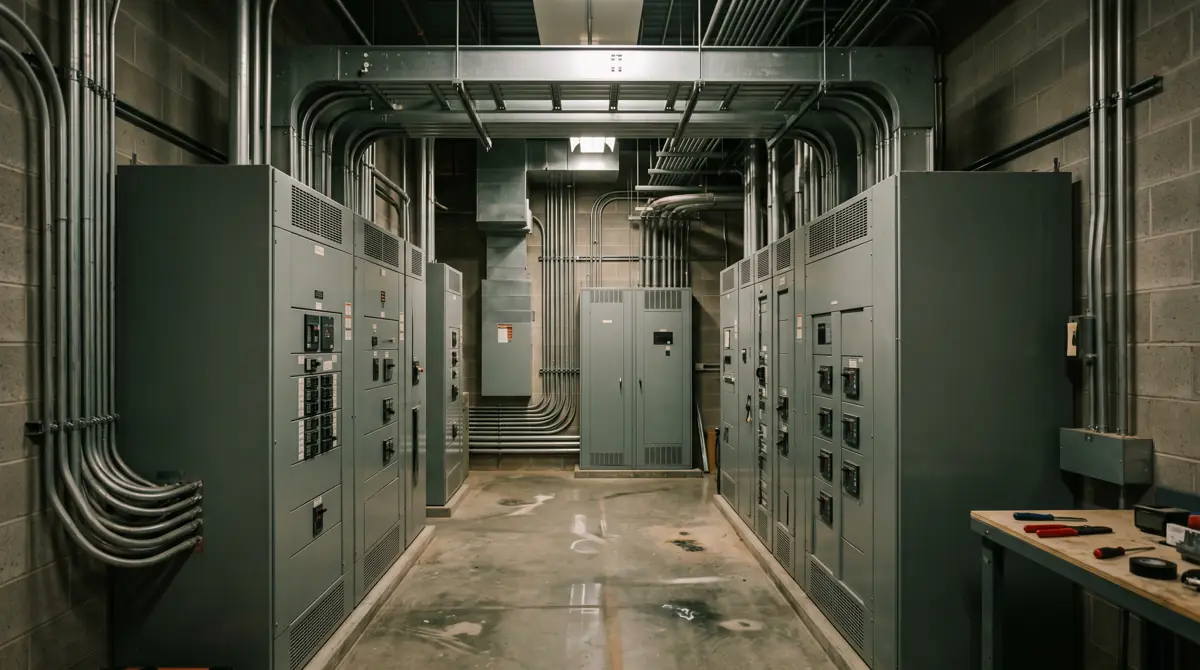
Grid operators now plan for far more load: ERCOT requests reached 438 GW by June 2026
Interconnection requests and load forecasts are not consumption. They show what developers are asking for and what grid planners expect, and both have risen sharply since 2024. Each figure below is labelled with its publisher and date.
ERCOT, which runs most of the Texas grid, reported about 189 GW of large loads seeking interconnection on September 2, 2025, against 56 GW in September 2024, with about 69% data centers (ERCOT, September 2025). The total reached 410 GW on March 26, 2026, about 87% data centers (ERCOT, April 2026), and 438 GW at the June 2026 board update (ERCOT, June 2026). ERCOT's July 29, 2026 Senate briefing gave about 474 GW as of June 2026, about 90% data centers (ERCOT Senate briefing).
| As of | Large loads seeking interconnection (GW) | Data center share | ERCOT document |
|---|---|---|---|
| September 2024 | 56 | not stated | Board, Sep 22-23, 2025 (comparison figure) |
| December 2024 | 63 | not stated | Board, Dec 8-9, 2025 (comparison figure) |
| September 2, 2025 | 189 | about 69% | Board, Sep 22-23, 2025 |
| November 18, 2025 | 226 | about 73% | Board, Dec 8-9, 2025 |
| January 20, 2026 | 232 | about 72% | Board, Feb 9-10, 2026 |
| March 26, 2026 | 410 | about 87% | Board, Apr 20-21, 2026 |
| June 2026 (board update) | 438 | not stated | Board, Jun 1-2, 2026 |
| June 2026 (Senate briefing) | 474 | about 90% | Senate Business and Commerce, Jul 29, 2026 |
| July 28, 2026: eligible for Batch Zero | 205 | not stated | Senate Business and Commerce, Jul 29, 2026 |
Requests from loads of 75 MW or more; not commitments. Board and Senate figures for June 2026 differ in timing and scope.
Source: [21][22][23][24][25][26] Electric Reliability Council of Texas; Electric Reliability Council of Texas; Electric Reliability Council of Texas; Electric Reliability Council of Texas; Electric Reliability Council of Texas; Electric Reliability Council of Texas
GW of requests at each ERCOT board update
Source: ERCOT board presentations, September 2025 to June 2026 (Internet Archive copies)
ERCOT closed its request-by-request process on July 10, 2026 and moved to a batch study called Batch Zero for loads of 75 MW or more. About 205 GW of large load was eligible for Batch Zero based on existing studies as of July 28, 2026. ERCOT's June 2026 board deck said the vast majority of requests had no studies submitted, and its Quarterly Stability Assessment expected about 3.9 GW of large load to energize in Q4 2026. ERCOT's September 2026 board deck moved large-load figures to a separate Batch Zero update that was not retrieved for this edition.
PJM's January 2026 load forecast projects RTO summer peak growth of 3.6% a year and net energy growth of 5.3% a year over ten years, with the summer peak at 222,106 MW in 2036 (PJM 2026 Load Forecast). Its January 2024 forecast had 1.6% and 2.3% (PJM 2024 Load Forecast). For 2039, the last year in the 2024 report, the 2026 forecast is 45,161 MW (23.7%) higher on summer peak and 419,658 GWh (37.4%) higher on energy. PJM lists data center load growth as an adjustment in most of its zones.
| Forecast item | 2024 report (Jan 2024) | 2026 report (Jan 2026) | Change |
|---|---|---|---|
| PJM RTO summer peak, 2034 (MW) | 176,822 | 211,882 | +35,060 |
| PJM RTO summer peak, 2039 (MW) | 190,752 | 235,913 | +45,161 |
| PJM RTO net energy, 2034 (GWh) | 1,021,955 | 1,348,192 | +326,237 |
| PJM RTO net energy, 2039 (GWh) | 1,120,928 | 1,540,586 | +419,658 |
| Average annual summer peak growth, next 10 years | 1.6% | 3.6% | +2.0 points |
| Average annual net energy growth, next 10 years | 2.3% | 5.3% | +3.0 points |
| Dominion zone summer peak, 2030 (MW), 2026 report only | not compared | 31,939 | |
| Dominion zone net energy, 2036 (GWh), 2026 report only | not compared | 297,069 |
2026 report values for 2034 and 2039 are derived from the data workbook (highest June to August monthly peak; sum of monthly energy).
Source: [18][19][20] PJM Interconnection; PJM Interconnection; PJM Interconnection
MW, PJM RTO; January 2024 report versus January 2026 report
Source: PJM 2024 and 2026 Load Forecast Reports and 2026 data workbook (Internet Archive copies)
PJM's 2026 forecast is lower than its 2025 forecast in the near term through 2032; the 2028 summer peak is 4,414 MW lower. PJM cites updated electric vehicle and economic forecasts and a new rule that near-term large-load adjustments need firm commitments, with longer-term projects derated. EIA reports PJM now expects Dominion zone summer peak growth of 5.4% a year over ten years, down from 6.3% in the 2025 forecast (EIA).
NERC's 2025 Long-Term Reliability Assessment, published in January 2026, projects aggregated summer peak growth of over 224 GW over ten years, 69% more than the 132 GW in the prior year's assessment, and says new data centers account for most of the increase (NERC 2025 LTRA). NERC notes Texas data center projections were reduced by almost 50% of requested load to reflect how existing sites actually ramp.
| Grid area (NERC 2025 LTRA) | Data center or large-load item | Value | Horizon |
|---|---|---|---|
| All NERC assessment areas | Ten-year summer peak demand growth | over 224 GW (prior year: 132 GW) | 2026 to 2035 |
| ERCOT | Forecast large-load interconnections | 45 GW, of which 23 GW data centers | by 2030 |
| ERCOT | Summer peak total internal demand | 94,650 MW to 154,077 MW | 2026 to 2035 |
| PJM | Summer peak demand growth | 56 GW to 210 GW | to 2035 |
| PJM | Annual net energy growth | 4.8% per year (prior year: 2.3%) | 10 years |
| MISO | Data center load additions | 18 GW | by 2035 |
| WECC | Planned data centers as share of demand | 10% on average, up to 40% for some balancing authorities | LTRA horizon |
| WECC-Northwest | Peak load increase driven by data centers | 6.6 GW (19%) | 10 years |
Forecasts reflect load-serving entity submissions from mid-2025. ERCOT and PJM have since revised their forecasts.
Source: [17] North American Electric Reliability Corporation
Utility filings: 53.8 GW in Dominion's contract stages and 70,168 MW of Georgia data center projects
Utility filings with state commissions give the most granular public view of where data center load is being connected. They measure requested or contracted capacity, not electricity used, and the stages differ by utility.
Dominion Energy Virginia reported 53.8 GW of data center contracted capacity in July 2026: 32.4 GW under substation engineering letters, 9.4 GW under construction letters and 12.0 GW under signed Electric Service Agreements (Dominion Q2 2026 slides). The total was 16.5 GW in July 2023, so it rose 3.26 times in three years. Signed service agreements were 22.3% of the July 2026 total. Dominion told WTVR in October 2026 that about 12,000 MW of data center capacity is under contract in its retail territory (WTVR).
Dominion's 2026 IRP Update, filed October 15, 2026, reports about 25,000 MW of large-load delivery point requests as of February 2026 with connection dates through 2031, and models data center demand as seven large customer segments plus about 47 other data center customers (Dominion 2026 IRP Update). Using PJM's 2026 forecast, annual energy in the Dominion zone grows at 5.2% a year over 20 years; the PJM data workbook shows it doubling from 148,390 GWh in 2026 to 297,069 GWh in 2036 (PJM data workbook).
GW; ESA = Electric Service Agreement, CLOA = construction letter, SELOA = substation engineering letter
Source: Dominion Energy, second-quarter 2026 earnings call slides (July 31, 2026)
Georgia Power's Q1 2026 report to the Georgia Public Service Commission lists 12,400 MW of customer commitments across 31 large-load customers as of March 31, 2026, up from 3,600 MW at its October 2023 IRP Update, and a large-load pipeline of 73,100 MW through the mid-2030s (Georgia Power Q1 2026 report). Of the 113 projects in the attachment, 101 (89.4%) are labelled Data Center/Crypto, carrying 70,168 MW (95.9%) of announced load. Committed Data Center/Crypto projects number 26, with 11,750 MW. Georgia Power says 8,500 MW of committed load has broken ground.
| Utility filing | As of | Measure | Value |
|---|---|---|---|
| Dominion Energy Virginia, Q2 2026 slides | July 2023 | Data center contracted capacity, all stages | 16.5 GW |
| Dominion Energy Virginia, Q2 2026 slides | December 2025 | Data center contracted capacity, all stages | 48.5 GW |
| Dominion Energy Virginia, Q2 2026 slides | March 2026 | Data center contracted capacity, all stages | 51.0 GW |
| Dominion Energy Virginia, Q2 2026 slides | July 2026 | Data center contracted capacity, all stages | 53.8 GW |
| Dominion Energy Virginia, Q2 2026 slides | July 2026 | Of which under Electric Service Agreements | 12.0 GW |
| Dominion Energy Virginia, 2026 IRP Update | February 2026 | Large-load delivery point requests through 2031 | 25,000 MW |
| Dominion Energy Virginia, 2026 IRP Update | 2026 | Data center customers in the forecast model | 7 named segments plus about 47 others |
| Georgia Power, Q1 2026 large load report | March 31, 2026 | Large-load customer commitments | 12,400 MW across 31 customers |
| Georgia Power, Q1 2026 large load report | March 31, 2026 | Committed load that has broken ground | 8,500 MW |
| Georgia Power, Q1 2026 large load report | March 31, 2026 | Large-load pipeline through the mid-2030s | 73,100 MW |
| Georgia Power, Q1 2026 large load report | March 31, 2026 | Data Center/Crypto projects in the pipeline (derived) | 101 of 113 projects, 70,168 MW |
Contract stages and pipeline definitions differ by utility. Georgia's Data Center/Crypto count is derived from the redacted project attachment.
Source: [28][29][30] Dominion Energy Virginia, filed with the Virginia State Corporation Commission; Dominion Energy; Georgia Power Company, filed with the Georgia Public Service Commission
One data center campus in Georgia Power's filing asks for 120 MW to 3,500 MW
No national dataset reports the draw of individual data centers. Georgia Power's attachment, with names redacted, is the most detailed public list found: the median committed data center project asks for 240 MW.
Among Georgia Power's 26 committed Data Center/Crypto projects (contract or request for service), announced loads run from 120 MW to 1,429 MW, with a median of 240 MW. Across all 101 Data Center/Crypto projects in the pipeline the median is 481 MW, the largest is 3,500 MW, and 22 projects announce 1,000 MW or more. These are customer-announced loads at full ramp, not metered demand.
| Georgia Power project stage (Data Center/Crypto segment) | Projects | Announced load (MW) | Median per project (MW) | Smallest (MW) | Largest (MW) |
|---|---|---|---|---|---|
| Contract for Electric Service | 19 | 9,149 | 240 | 120 | 1,429 |
| Request for Service | 7 | 2,601 | 300 | 216 | 693 |
| Technical Review | 75 | 58,418 | 550 | 144 | 3,500 |
| All Data Center/Crypto projects | 101 | 70,168 | 481 | 120 | 3,500 |
Announced load at full ramp as listed in the filing; project names redacted. Derived by this report from the attachment.
Source: [30] Georgia Power Company, filed with the Georgia Public Service Commission
Other filings give thresholds rather than averages. Dominion's new GS-5 rate class, effective January 2027, applies to customers with contracted or measured demand of 25 MW or more and a load factor of 75% or more. ERCOT's Batch Zero process covers loads of 75 MW or more, and ERCOT's December 2025 board deck noted that many requests exceed 1 GW per site. At the national level, LBNL's 2024 estimate equals an average draw of about 21.9 GW, and its 2030 Reference Case implies 148 GW of interconnection capacity at 50% utilization.
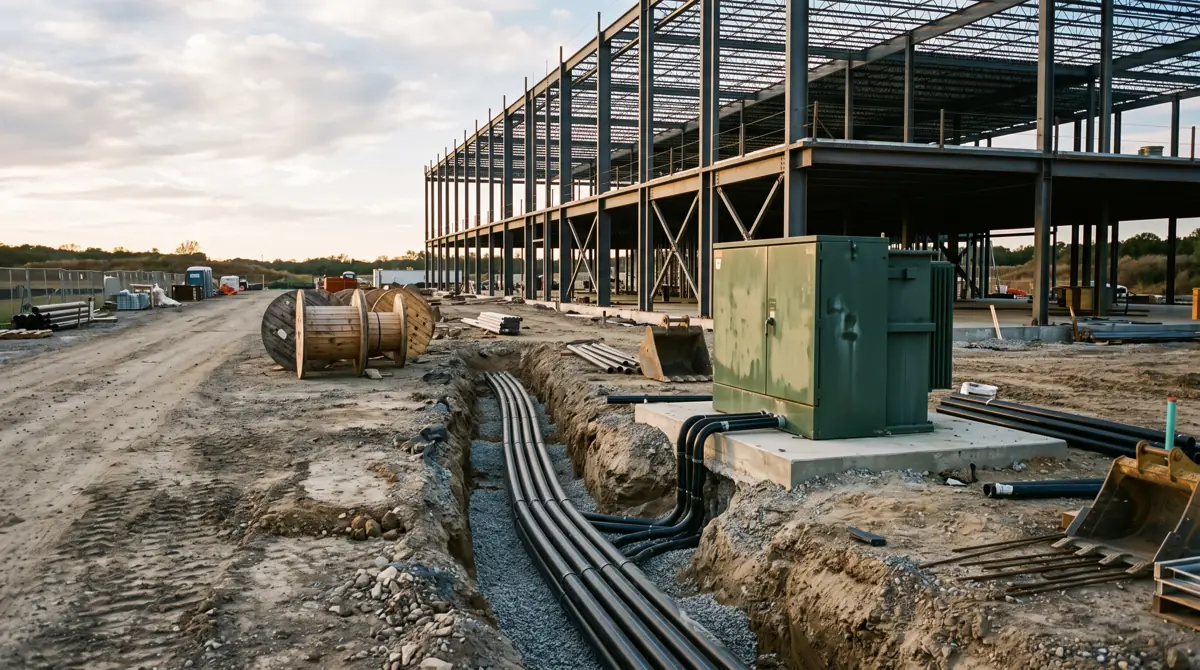
What the new data center load means for electrical contractors
The filings show where utility-side and customer-side electrical construction is concentrated. Jobs, pay and construction spending for data center work are covered in a separate report.
The load is concentrated in a few service areas. Seven states account for 74.2% of national commercial sales growth since 2019, and Dominion's construction letters, which authorise utility construction, covered 9.4 GW of data center capacity in July 2026. Georgia Power reports 21 committed large-load projects have broken ground, ten of them online. Labour demand, wages and construction spending for this work are in the data center electrician report.
- Equipment lead times for utility-side work are tracked in the transformer shortage report.
- How large-load growth feeds into residential rates and PJM capacity prices is covered in why electric bills are rising.
- Grid reliability records by state are in power outages by state.
- Market and company coverage for contractors is in the business section.
Forecasts in this report are not commitments. NERC, PJM and ERCOT all state that some large-load projects have slowed or failed to materialise in the near term while requests for later years keep rising.
How the benchmark is built
Dated ledger of official US data center electricity estimates
FormulaEach estimate listed with publication date, year covered, TWh, share and method; IEA US values derived as 45% x 415 TWh and 186.75 + 240 TWh
Inputs: fact sheet rows for LBNL 2024, LBNL 2025 Update, DOE, IEA (see table t1) (fact sheet rows)
Result: 192 TWh in 2024 (LBNL 2025 Update); 2030 forecasts from 426.8 TWh (IEA, derived) to 649 TWh (LBNL Reference Case)
The two most recent bottom-up estimates agree on 2024 within about 5 TWh (192 versus 186.8) but diverge by more than 200 TWh for 2030, mainly on accelerator shipments.
Limitations: IEA figures are derived from rounded shares; EPRI figures are quoted second hand by LBNL.
Implied LBNL Reference Case use in 2026
Formula192 TWh x 1.22 x 1.29
Inputs: rows for 192 TWh, 22% and 29% growth (derived d3, d4) (fact sheet rows)
Result: 302.2 TWh
On LBNL's central path, 2026 data center use would be more than 50% above 2024.
Limitations: Forecast; LBNL's rates are rounded and 2025 is partly projected.
Commercial-sector sales growth by state, 2019 to latest 12 months
Formulasum of Sep 2025 to Aug 2026 monthly sales minus calendar 2019 sales, by state
Inputs: EIA-861M state rows (derived d8 to d20) (fact sheet rows)
Result: US +176.0 TWh (12.9%); Texas +42.2 TWh; Virginia +34.2 TWh (63.3%); seven flagged states 74.2% of the national increase
Commercial growth is concentrated: Texas and Virginia alone supply 43.4% of it, while 14 jurisdictions sold less commercial electricity than in 2019.
Limitations: Sector class depends on utility billing; weather and non-data center growth are included; 2026 months are preliminary.
ERCOT large-load requests, year on year
Formula189 GW (Sep 2025) minus 56 GW (Sep 2024); 438 GW (Jun 2026) minus 189 GW
Inputs: ERCOT rows (derived d23 to d29) (fact sheet rows)
Result: +133 GW (3.4 times) in the year to September 2025; +249 GW in the following nine months
The request total grew faster in the nine months to June 2026 than in the full prior year, as data centers rose to about 90% of requests.
Limitations: No June 2025 ERCOT figure was retrieved, so the latest interval is nine months; requests are not commitments and most had no studies submitted.
PJM forecast revision for 2039, 2024 report versus 2026 report
Formula2026 report value minus 2024 report value for the same year
Inputs: PJM rows (derived d30 to d35) (fact sheet rows)
Result: Summer peak +45,161 MW (23.7%); net energy +419,658 GWh (37.4%)
Two years of forecast updates added more to PJM's 2039 energy outlook than the whole 307,600 GWh 15-year increase the 2024 report projected.
Limitations: The 2026 summer peak is derived from the monthly data workbook; it matches PJM's published 2036 and 2046 values.
Data center load named in Dominion and Georgia Power filings
FormulaDominion: 53.8 / 16.5 and 12.0 / 53.8; Georgia: count and MW of Data Center/Crypto rows in the Q1 2026 attachment
Inputs: Dominion and Georgia Power rows (derived d37 to d48) (fact sheet rows)
Result: Dominion 53.8 GW in July 2026 (3.26 times July 2023; 22.3% under signed agreements); Georgia 101 projects, 70,168 MW (95.9% of announced MW); 26 committed, 11,750 MW
In both utilities most of the named capacity is at early stages, and nearly all large-load pipeline megawatts in Georgia are data centers or crypto.
Limitations: Company figures; Georgia rows pair columns by order across pages, and the totals match the filing's 73,100 MW and 12,400 MW within rounding.
Where contractors differ
- US data centers used an estimated 192 TWh of electricity in 2024, 4.7% of total US electricity consumption (LBNL 2025 Update, June 2026).[1]
- LBNL estimates US data center electricity use grew 14% from 2023 to 2024 and projects 22% growth in 2025 and 29% in 2026 in its Reference Case.[1]
- Applying LBNL's growth rates to its 2024 figure implies about 302.2 TWh of US data center use in 2026 (derived, Reference Case).[1]
- LBNL's 2030 Reference Case is 649 TWh (11.8% of forecast US electricity), with a Compounded Uncertainty range of 521 to 843 TWh.[1]
- The LBNL December 2024 report estimated 176 TWh (4.4%) for 2023 and 76 TWh (1.9%) for 2018, and a range of 325 to 580 TWh (6.7% to 12.0%) for 2028.[3]
- IEA's Energy and AI report (2025) puts the US at 45% of 415 TWh of global data centre use in 2024, which implies about 186.8 TWh, and projects a US increase of around 240 TWh by 2030.[13][14]
- US commercial-sector retail electricity sales rose from 1,360.9 TWh in 2019 to 1,536.9 TWh in the 12 months ending August 2026, an increase of 12.9% (EIA-861M).[5]
- Virginia commercial-sector electricity sales rose 34.2 TWh (63.3%) between 2019 and the 12 months ending August 2026, 19.4% of the national increase (EIA-861M).[5]
- Oregon (+71.5%) and Nebraska (+77.4%) recorded the largest percentage gains in commercial electricity sales among the top 20 states by TWh growth between 2019 and the 12 months to August 2026.[5]
- ERCOT was tracking about 189 GW of large loads seeking interconnection on September 2, 2025, compared with 56 GW in September 2024; about 69% were data centers.[21]
- ERCOT tracked 438 GW of large-load requests at its June 2026 board update and told the Texas Senate about 474 GW as of June 2026, about 90% data centers.[25][26]
- PJM's 2026 forecast puts PJM RTO net energy at 1,540,586 GWh in 2039, 37.4% above the 1,120,928 GWh in its 2024 forecast for the same year.[19][20]
- NERC's 2025 Long-Term Reliability Assessment (January 2026) projects ten-year summer peak growth of over 224 GW across North America, 69% more than the 132 GW projected a year earlier, mostly from data centers.[17]
- Dominion Energy Virginia reported 53.8 GW of data center capacity in contract stages in July 2026, 3.26 times the 16.5 GW of July 2023; 12.0 GW was under signed Electric Service Agreements.[29]
- Georgia Power's Q1 2026 large-load attachment lists 101 Data Center/Crypto projects with 70,168 MW of announced load, 95.9% of the 73,130 MW listed.[30]
In short
- Lawrence Berkeley National Laboratory (LBNL) estimates US data centers used 192 TWh of electricity in 2024, 4.7% of national consumption, up from 176 TWh (4.4%) in 2023 in its December 2024 report.
- LBNL's June 2026 Reference Case puts 2030 data center use at 649 TWh, or 11.8% of forecast US electricity, with a scenario range of 521 to 843 TWh (9.5% to 15.3%).
- No federal agency meters data center electricity directly; every national figure in this report is a model estimate, and EIA records data center load inside commercial and industrial sales.
- EIA-861M data show US commercial-sector sales up 176.0 TWh (12.9%) between calendar 2019 and the 12 months ending August 2026; Texas (+42.2 TWh) and Virginia (+34.2 TWh) account for 43.4% of that growth.
- Seven states named as data center hubs (Virginia, Texas, Georgia, Ohio, Arizona, Oregon, Iowa) account for 74.2% of national commercial sales growth over the period.
- ERCOT's large-load request total rose from 56 GW in September 2024 to 189 GW in September 2025 and 438 GW at its June 2026 board update; ERCOT put the data center share at about 90% in June 2026.
- PJM's January 2026 load forecast puts the 2039 RTO summer peak at 235,913 MW, 23.7% above the 190,752 MW in its January 2024 forecast for the same year.
- Utility filings show Dominion Energy Virginia with 53.8 GW of data center capacity in contract stages in July 2026 (12.0 GW under signed service agreements) and Georgia Power listing 101 Data Center/Crypto projects totalling 70,168 MW in its March 2026 pipeline.
What people search for
How much power does a data center use?
Large campuses now ask utilities for hundreds of megawatts each. In Georgia Power's Q1 2026 filing, committed data center projects announce a median of 240 MW and the largest pipeline project 3,500 MW. Dominion's large-load rate class starts at 25 MW. Nationally, LBNL's 192 TWh for 2024 equals an average draw of about 21.9 GW across all US data centers.
What percentage of US electricity do data centers use?
LBNL estimates 4.7% in 2024 (192 TWh), up from 4.4% in 2023 and 1.9% in 2018. Its June 2026 Reference Case reaches 11.8% of US electricity by 2030, within a range of 9.5% to 15.3%.
Which states have the most data center electricity demand?
No federal series reports data center use by state. Measured commercial sales growth since 2019 is largest in Texas (+42.2 TWh) and Virginia (+34.2 TWh), followed by Ohio, Georgia, Arizona and Oregon. EIA attributes Virginia's growth largely to data centers, and PJM's Dominion zone serves the largest data center concentration in the world, according to EIA.
Are data centers raising electricity demand?
Federal and grid sources say yes. EIA says data center electricity use is driving demand growth that averaged 1.7% a year from 2020 to 2025, against 0.1% from 2005 to 2019. The IEA says data centres supplied around half of US demand growth in 2025. NERC says new data centers account for most of the projected 10-year rise in North American peak demand.
Common questions
How much electricity did US data centers use in 2024?
About 192 TWh, or 4.7% of US electricity consumption, according to LBNL's 2025 Update published in June 2026. The estimate excludes cryptocurrency mining.
How much electricity did US data centers use in 2023?
LBNL's December 2024 report estimated 176 TWh, 4.4% of US consumption. The 2025 Update revised earlier years slightly downward.
How much electricity will data centers use by 2030?
LBNL's Reference Case is 649 TWh in 2030, 11.8% of forecast US electricity, with a range of 521 to 843 TWh. IEA's 2025 Base Case implies about 426.8 TWh for the US.
What did the 2024 LBNL report forecast for 2028?
A range of 325 to 580 TWh, or 6.7% to 12.0% of US electricity in 2028. The 2025 Update's 2028 Reference Case is 464 TWh.
How fast is US data center electricity use growing?
LBNL estimates 14% growth from 2023 to 2024 and projects 22% in 2025 and 29% in 2026 in its Reference Case, then a 21% compound annual rate to 2030.
Does EIA publish a data center electricity figure?
Not in the releases reviewed. EIA counts data centers inside commercial and industrial retail sales; its October 2026 Short-Term Energy Outlook forecasts commercial demand, which includes data centers, to grow 2.8% in 2027.
How much have commercial electricity sales grown since 2019?
US commercial-sector retail sales rose 176.0 TWh, or 12.9%, from 1,360.9 TWh in 2019 to 1,536.9 TWh in the 12 months ending August 2026 (EIA-861M).
How much large load is waiting to connect in Texas?
ERCOT tracked 438 GW of large-load interconnection requests at its June 2026 board update, up from 56 GW in September 2024. About 205 GW was eligible for its Batch Zero study as of July 28, 2026.
How much data center capacity has Dominion Energy contracted in Virginia?
Dominion reported 53.8 GW of data center capacity across its three contract stages in July 2026, of which 12.0 GW was under signed Electric Service Agreements.
How much has PJM raised its load forecast?
PJM's January 2026 forecast for 2039 is 235,913 MW of summer peak and 1,540,586 GWh of energy, 23.7% and 37.4% above its January 2024 forecast for the same year.
Get the data
Every table in this report is available as a CSV under CC BY 4.0. The fact sheet lists each value with its source URL and access date.
- derived_metrics.csv (CSV)
- fact_sheet.csv (CSV)
- Official and institutional estimates of US data center electricity use, by publication date (CSV)
- LBNL 2025 Update scenarios for 2030 (CSV)
- Commercial-sector electricity sales growth by state, 2019 to the latest 12 months (top 20 by TWh) (CSV)
- ERCOT large-load interconnection requests by date (CSV)
- PJM load forecast, January 2024 report versus January 2026 report (CSV)
- Data center load named in Dominion Energy Virginia and Georgia Power filings (CSV)
- Announced load of Georgia Power Data Center/Crypto projects by stage, March 31, 2026 (CSV)
- Data center and large-load items in NERC's 2025 Long-Term Reliability Assessment (CSV)
Cite this report
The figures to cite first
- US data center electricity use was an estimated 192 TWh in 2024, 4.7% of US electricity (LBNL 2025 Update, June 2026).[1]
- LBNL's 2030 Reference Case for US data centers is 649 TWh, 11.8% of forecast US electricity, with a 521 to 843 TWh range (LBNL, June 2026).[1]
- US commercial electricity sales grew 176.0 TWh from 2019 to the 12 months ending August 2026, led by Texas (+42.2 TWh) and Virginia (+34.2 TWh) (EIA-861M, October 2026 release).[5]
Quotable figures
- US data centers used an estimated 192 TWh of electricity in 2024, 4.7% of total US electricity consumption, according to Lawrence Berkeley National Laboratory's 2025 Update (June 2026).[1]
- LBNL's Reference Case projects US data center electricity use of 649 TWh in 2030, 11.8% of forecast US electricity, within a range of 521 to 843 TWh.[1]
- US commercial-sector electricity sales rose 176.0 TWh (12.9%) between 2019 and the 12 months ending August 2026, and Texas and Virginia supplied 43.4% of that growth (EIA-861M).[5]
- Virginia's commercial electricity sales rose 63.3%, from 54.0 TWh in 2019 to 88.2 TWh in the 12 months ending August 2026 (EIA-861M).[5]
- ERCOT tracked 438 GW of large-load interconnection requests in Texas at its June 2026 board update, against 56 GW in September 2024.[25][21]
- PJM's January 2026 forecast for 2039 net energy, 1,540,586 GWh, is 37.4% higher than its January 2024 forecast for the same year.[19][20]
- Dominion Energy Virginia reported 53.8 GW of data center capacity in contract stages in July 2026, including 12.0 GW under signed Electric Service Agreements.[29]
Summary for editors
US data centers used an estimated 192 TWh of electricity in 2024, 4.7% of national consumption, according to Lawrence Berkeley National Laboratory's June 2026 update. Its central case reaches 649 TWh, or 11.8% of US electricity, by 2030. An Electrical Contractors and Wiring Data Desk analysis of EIA-861M data finds US commercial electricity sales rose 176.0 TWh between 2019 and the 12 months ending August 2026, with Texas and Virginia supplying 43.4% of the increase and Virginia's commercial sales up 63.3%. Grid operators are planning for more: ERCOT tracked 438 GW of large-load requests in June 2026, up from 56 GW in September 2024, and PJM's 2026 forecast for 2039 energy is 37.4% above its 2024 forecast. Dominion Energy Virginia reported 53.8 GW of data center capacity in contract stages, and Georgia Power's filing lists 101 data center or crypto projects totalling 70,168 MW. Contracted capacity and requests are not consumption; every national figure is a model estimate.
Headlines the data supports
- US data centers used 192 TWh in 2024, 4.7% of the nation's electricity
- Texas and Virginia supplied 43.4% of US commercial power sales growth since 2019
- Texas grid large-load requests hit 438 GW, up from 56 GW in September 2024
- PJM's 2039 energy forecast is now 37.4% higher than two years ago
- Virginia commercial electricity sales up 63.3% since 2019 as data centers expand
Citation
Electrical Contractors and Wiring. (2026). Data center power consumption in the US: official estimates, state sales and grid forecasts. Retrieved from https://electricalcontractorsandwiring.com/data/data-center-power-consumption/
Reuse
Data and tables are licensed CC BY 4.0. Attribution: “Source: Electrical Contractors and Wiring, Data center power consumption in the US: official estimates, state sales and grid forecasts” with a link to this page.
How we built this report
Source selection: national electricity estimates come from LBNL's bottom-up model (DOE-funded, Tier 1), checked against IEA (Tier 2). Measured data come from EIA's Form EIA-861M state sales file (August 2026 release, the latest at access). Forecasts come from grid operators (ERCOT, PJM), NERC and utility filings with state commissions. Consultancy figures (EPRI) appear only as quoted by LBNL and are never headline figures. Every source was opened on 2026-11-03 or 2026-11-05 and a copy saved in raw/.
Inclusion and exclusion: measured sales and model estimates are kept separate from forecasts, requests and contracted capacity, and each forecast is labelled with its publisher and date. Pages that blocked automated access (ERCOT, PJM by DNS failure, Virginia JLARC, EPRI, Virginia Business, several news sites) were retried with a browser user agent, then taken from Internet Archive snapshots, whose URLs are cited; pages with no snapshot are listed in excluded.md. Bill impacts, PJM capacity prices, transformer supply, utility rankings, reliability, and data center jobs and pay are covered in other reports and linked, not repeated.
Conflicting numbers: where the same quantity appears in two documents (ERCOT's June 2026 board figure of 438 GW and its Senate figure of about 474 GW; EIA's 30.0 million MWh for Virginia against 32.6 TWh in the later EIA-861M file), both are shown with dates. LBNL's 2025 Update supersedes its 2024 report for 2024 onward; the 2024 report is kept for 2018 and 2023 and its 2028 range.
Derived metrics: state growth is the sum of 12 monthly EIA-861M sales (September 2025 to August 2026) minus calendar 2019 sales, by sector. PJM 2026 values for 2034 and 2039 are the highest June to August monthly peak and the sum of monthly energy in PJM's data workbook; this method reproduces PJM's published 2036 and 2046 figures exactly. Georgia Power Data Center/Crypto counts pair the attachment's Segment column with its Stage and Announced Load columns by row order; the resulting totals (73,130 MW and 31 committed customers with 12,357 MW) match the filing's 73,100 MW and 12,400 MW. All formulas and inputs are in derived_metrics.csv and scripts/.
Limitations: data center electricity is not metered nationally; EIA sector classes depend on utility billing, so data center load can sit in commercial or industrial sales; sales are not weather-normalised and 2026 months are preliminary. Interconnection requests, pipelines and contracted capacity overstate likely load, and grid operators have cut near-term forecasts as some projects slipped. Georgia Power's segment label combines data centers and crypto mining. A Georgia Power Q2 2026 report, ERCOT's September 2026 Batch Zero update and Dominion's Q3 2026 slides could not be retrieved for this edition. This report is not investment, legal or engineering advice.
Last updated 2026-11-05. EIA-861M is checked monthly (next release end of November 2026); LBNL, PJM, NERC and utility filings are checked as new editions appear.
This report presents published data with its limitations. It is not legal, financial or investment advice.
Sources by tier
Tier 1: primary and official sources (26)
- [1] Lawrence Berkeley National Laboratory for the U.S. Department of Energy. United States Data Center Energy Usage Report: 2025 Update (Smith et al., LBNL, published 2026-06-18), Internet Archive copy of the eScholarship PDF. 2016 to 2024 history, scenarios to 2030. Accessed 2026-11-05.
- [2] Lawrence Berkeley National Laboratory, Energy Technologies Area. United States Data Center Energy Usage Report: 2025 Update, publication record and abstract. published 06/2026. Accessed 2026-11-03.
- [3] Lawrence Berkeley National Laboratory for the U.S. Department of Energy. 2024 United States Data Center Energy Usage Report (Shehabi et al., LBNL-2001637, December 2024), Internet Archive copy. 2014 to 2023 history, scenarios to 2028. Accessed 2026-11-03.
- [4] U.S. Department of Energy. DOE Releases New Report Evaluating Increase in Electricity Demand from Data Centers (press release, 2024-12-20). 2014 to 2028. Accessed 2026-11-05.
- [5] U.S. Energy Information Administration. Form EIA-861M sales and revenue by state and sector, monthly, 1990 to August 2026 (sales_revenue.xlsx). Jan 2019 to Aug 2026 (2026 preliminary). Accessed 2026-11-03.
- [6] U.S. Energy Information Administration. Monthly Electric Power Industry Report (Form EIA-861M) data page: release schedule. released 2026-10-23 for August 2026. Accessed 2026-11-03.
- [7] U.S. Energy Information Administration. Commercial electricity sales have soared in Virginia, driven by data centers (Today in Energy, 2026-05-05). 2019 to 2025. Accessed 2026-11-03.
- [8] U.S. Energy Information Administration. Commercial electricity demand grew fastest in states with rapid computing facility growth (Today in Energy, 2024-06-28). 2019 to 2023. Accessed 2026-11-03.
- [9] U.S. Energy Information Administration. We expect rapid electricity demand growth in Texas and the mid-Atlantic (Today in Energy, 2025-07-31). STEO July 2025, forecasts for 2025 and 2026. Accessed 2026-11-03.
- [10] U.S. Energy Information Administration. Fossil generation could rise with faster-than-expected growth in data center power demand (Today in Energy, 2026-03-12). 2005 to 2027. Accessed 2026-11-03.
- [11] U.S. Energy Information Administration. After more than a decade of little change, U.S. electricity consumption is rising again (Today in Energy, 2025-05-13). 2020 to 2026. Accessed 2026-11-03.
- [12] U.S. Energy Information Administration. Short-Term Energy Outlook, electricity section (release 2026-10-06, next release 2026-11-10). forecast through 2027. Accessed 2026-11-05.
- [17] North American Electric Reliability Corporation. 2025 Long-Term Reliability Assessment (January 2026). 2026 to 2035, data collected mid-2025. Accessed 2026-11-05.
- [18] PJM Interconnection. 2026 PJM Load Forecast Report (posted 2026-01-14), Internet Archive copy. 2026 to 2046. Accessed 2026-11-05.
- [19] PJM Interconnection. 2026 PJM Load Forecast Report data workbook (monthly peak MW and energy GWh by zone), Internet Archive copy. 2026 to 2046. Accessed 2026-11-05.
- [20] PJM Interconnection. 2024 PJM Load Forecast Report (January 2024, revised 2024-02-01), Internet Archive copy. 2024 to 2039. Accessed 2026-11-05.
- [21] Electric Reliability Council of Texas. Board item 16.2, System Planning and Weatherization Update (September 22-23, 2025), Internet Archive copy. queue as of 2025-09-02. Accessed 2026-11-05.
- [22] Electric Reliability Council of Texas. Board item 16.2, System Planning and Weatherization Update (December 8-9, 2025, revised), Internet Archive copy. queue as of 2025-11-18. Accessed 2026-11-05.
- [23] Electric Reliability Council of Texas. Board item 9.2, Interconnection and Grid Analysis Update (February 9-10, 2026), Internet Archive copy. queue as of 2026-01-20. Accessed 2026-11-05.
- [24] Electric Reliability Council of Texas. Board item 9, Interconnection and Grid Analysis Update (April 20-21, 2026), Internet Archive copy. queue as of 2026-03-26. Accessed 2026-11-05.
- [25] Electric Reliability Council of Texas. Board item 8, Interconnection and Grid Analysis Update (June 1-2, 2026), Internet Archive copy. queue at the June 2026 board update. Accessed 2026-11-05.
- [26] Electric Reliability Council of Texas. ERCOT Update to the Senate Committee on Business and Commerce (2026-07-29), Internet Archive copy. queue as of June 2026; Batch Zero data as of 2026-07-28. Accessed 2026-11-05.
- [27] Electric Reliability Council of Texas. Board item 10, Interconnection and Grid Analysis Update (September 14-15, 2026, revised), Internet Archive copy. September 2026. Accessed 2026-11-05.
- [28] Dominion Energy Virginia, filed with the Virginia State Corporation Commission. Virginia Electric and Power Company 2026 Integrated Resource Plan Update, SCC Case No. PUR-2026-00163 (filed 2026-10-15). 2026 to 2046. Accessed 2026-11-05.
- [30] Georgia Power Company, filed with the Georgia Public Service Commission. Georgia Power Q1 2026 Large Load Economic Development Report, Georgia PSC Docket No. 56002 (filed 2026-05-15). as of 2026-03-31. Accessed 2026-11-05.
- [32] Electric Reliability Council of Texas. Large Load Integration page (Batch Zero process), Internet Archive copy of 2026-10-22. October 2026. Accessed 2026-11-05.
Tier 2: trade bodies, market research, company data (5)
- [13] International Energy Agency. Energy and AI, executive summary (2025). 2024 base year, projections to 2030 and 2035. Accessed 2026-11-05.
- [14] International Energy Agency. Energy and AI, Energy demand from AI (2025). 2024 base year, projections to 2030. Accessed 2026-11-05.
- [15] International Energy Agency. Global Energy Review 2026, Electricity demand. 2025. Accessed 2026-11-05.
- [16] International Energy Agency. Electricity 2026, Demand. 2026 to 2030. Accessed 2026-11-05.
- [29] Dominion Energy. Dominion Energy second-quarter 2026 earnings call slides (2026-07-31), slide 5: data center contracted capacity. July 2023 to July 2026. Accessed 2026-11-05.
Tier 3: journalism and expert commentary (1)
- [31] WTVR CBS 6 Richmond. Data center demand surges; what will Dominion do if those projects fall through? (2026-10-27). October 2026. Accessed 2026-11-05.