Aluminum wiring and knob-and-tube wiring: how many US homes are old enough, by state
- Data
- U.S. Census Bureau American Community Survey 2020-2024 5-year estimates, Table B25036 (tenure by year structure built); American Housing Survey 2023
- Period
- ACS 2020 to 2024; AHS 2023; CBP 2023; CPSC and program documents 1974 to 2026
- Release used
- 2026-01-29
- Next release
- ACS 2025 1-year estimates: not posted as of 2026-10-27; next ACS 5-year (2021-2025): date not announced in sources opened
- Geography
- 50 states and the District of Columbia
- Sources
- 27 (22 official)
No federal survey counts homes that still have knob-and-tube or aluminum wiring. The housing old enough to have it is large: 14.7 million occupied US homes were built before 1940, and 30.9 million were built from 1960 to 1979, the decades spanning the mid-1960s to mid-1970s aluminum branch wiring era (Census ACS 2020-2024).
14.7 million occupied US homes were built before 1940, the knob-and-tube era
Pre-1940 housing is concentrated in the Northeast and Midwest. The District of Columbia (31.8%), Massachusetts (30.3%), New York (29.5%) and Rhode Island (29.0%) have the highest shares; Nevada (1.0%) has the lowest.
The American Community Survey (ACS) 2020-2024 5-year estimates count 14,678,140 occupied housing units built in 1939 or earlier, 11.4% of 129,227,496 occupied US homes (margin of error 57,463; ACS 2020-2024, Table B25036). The single-year ACS 2024 estimate is 14,739,173 homes, 11.1% of occupied units. Counting vacant units too, 16.9 million US housing units were built before 1940 (11.7% of all units, ACS 2020-2024 Table B25034).
New York has the most occupied pre-1940 homes, 2,279,316, followed by Pennsylvania (1,269,313), California (1,172,029), Illinois (979,229) and Ohio (870,272). These five states hold 6,570,159 pre-1940 homes, 44.8% of the US total. The Northeast and Midwest Census regions together hold 70.3% of occupied pre-1940 homes but only 39.1% of all occupied homes (ACS 2020-2024).
Renters are more exposed than owners. In 2020-2024, 12.5% of renter-occupied homes were built before 1940, against 10.7% of owner-occupied homes; renters occupy 38.4% of all occupied pre-1940 homes (ACS Table B25036).
Occupied housing units built 1939 or earlier, ACS 2020-2024 5-year estimates
Source: U.S. Census Bureau, American Community Survey 2020-2024, Table B25036. ECW Data Desk calculation.
Occupied housing units built 1939 or earlier, ACS 2020-2024
Source: U.S. Census Bureau, American Community Survey 2020-2024, Table B25036.
Show all 52 rows
| Rank | State | Occupied homes | Built 1939 or earlier | Margin of error (+/-) | Share built 1939 or earlier (%) | Share built before 1960 (%) |
|---|---|---|---|---|---|---|
| 1 | District of Columbia | 324,491 | 103,284 | 2,527 | 31.8 | 52.4 |
| 2 | Massachusetts | 2,785,042 | 843,709 | 6,915 | 30.3 | 46.3 |
| 3 | New York | 7,722,646 | 2,279,316 | 13,839 | 29.5 | 51.9 |
| 4 | Rhode Island | 441,570 | 127,851 | 3,118 | 29.0 | 47.3 |
| 5 | Vermont | 273,416 | 67,857 | 1,677 | 24.8 | 33.5 |
| 6 | Pennsylvania | 5,274,853 | 1,269,313 | 9,540 | 24.1 | 44.2 |
| 7 | Iowa | 1,315,707 | 295,165 | 3,560 | 22.4 | 36.9 |
| 8 | Maine | 597,159 | 132,342 | 2,628 | 22.2 | 33.1 |
| 9 | Illinois | 5,036,449 | 979,229 | 7,580 | 19.4 | 37.0 |
| 10 | Connecticut | 1,434,007 | 277,061 | 4,380 | 19.3 | 39.9 |
| 11 | New Hampshire | 555,822 | 99,842 | 2,219 | 18.0 | 27.6 |
| 12 | Ohio | 4,863,191 | 870,272 | 7,797 | 17.9 | 36.6 |
| 13 | Nebraska | 797,847 | 141,796 | 2,446 | 17.8 | 31.1 |
| 14 | Wisconsin | 2,479,480 | 437,776 | 4,459 | 17.7 | 33.2 |
| 15 | New Jersey | 3,507,701 | 603,391 | 6,757 | 17.2 | 37.7 |
| 16 | Minnesota | 2,307,955 | 354,554 | 3,636 | 15.4 | 28.6 |
| 17 | Indiana | 2,716,009 | 410,225 | 4,718 | 15.1 | 30.2 |
| 18 | South Dakota | 365,544 | 54,333 | 1,462 | 14.9 | 26.4 |
| 19 | Kansas | 1,174,060 | 166,104 | 2,847 | 14.1 | 30.8 |
| 20 | Michigan | 4,076,369 | 564,085 | 5,183 | 13.8 | 34.9 |
| 21 | West Virginia | 728,655 | 98,057 | 2,648 | 13.5 | 30.1 |
| 22 | Missouri | 2,508,227 | 311,868 | 4,547 | 12.4 | 26.5 |
| 23 | Montana | 458,859 | 56,533 | 1,560 | 12.3 | 24.9 |
| 24 | North Dakota | 331,063 | 35,845 | 1,260 | 10.8 | 22.3 |
| 25 | Oregon | 1,718,422 | 180,335 | 3,317 | 10.5 | 22.9 |
| 26 | Wyoming | 243,318 | 24,620 | 1,291 | 10.1 | 22.4 |
| 27 | Maryland | 2,362,928 | 232,977 | 4,017 | 9.9 | 25.5 |
| 28 | Washington | 3,064,820 | 287,852 | 3,738 | 9.4 | 20.3 |
| 29 | California | 13,548,091 | 1,172,029 | 8,547 | 8.7 | 26.6 |
| 30 | Kentucky | 1,814,469 | 154,102 | 2,687 | 8.5 | 20.9 |
| 31 | Delaware | 402,038 | 32,719 | 1,585 | 8.1 | 21.6 |
| 32 | Idaho | 713,005 | 54,110 | 1,631 | 7.6 | 16.9 |
| 33 | Colorado | 2,374,218 | 160,661 | 3,318 | 6.8 | 15.9 |
| 34 | Virginia | 3,365,732 | 213,790 | 3,555 | 6.4 | 18.3 |
| 35 | Oklahoma | 1,562,389 | 99,381 | 2,177 | 6.4 | 19.8 |
| 36 | Utah | 1,124,822 | 66,833 | 1,793 | 5.9 | 15.0 |
| 37 | Louisiana | 1,804,780 | 99,483 | 2,478 | 5.5 | 17.1 |
| 38 | Tennessee | 2,824,277 | 147,308 | 3,277 | 5.2 | 16.8 |
| 39 | North Carolina | 4,282,345 | 192,940 | 3,569 | 4.5 | 13.4 |
| 40 | Alabama | 1,997,247 | 88,053 | 2,426 | 4.4 | 14.9 |
| 41 | New Mexico | 837,414 | 33,622 | 1,451 | 4.0 | 16.4 |
| 42 | Arkansas | 1,205,987 | 45,826 | 1,642 | 3.8 | 12.3 |
| 43 | Georgia | 4,074,366 | 147,988 | 3,512 | 3.6 | 11.0 |
| 44 | Mississippi | 1,145,431 | 41,490 | 1,612 | 3.6 | 13.1 |
| 45 | South Carolina | 2,117,989 | 72,101 | 1,996 | 3.4 | 11.8 |
| 46 | Hawaii | 492,453 | 15,962 | 964 | 3.2 | 14.8 |
| 47 | Texas | 10,992,816 | 314,263 | 4,831 | 2.9 | 11.8 |
| 48 | Florida | 8,752,810 | 165,734 | 3,138 | 1.9 | 10.3 |
| 49 | Alaska | 270,533 | 4,312 | 412 | 1.6 | 7.4 |
| 50 | Arizona | 2,856,081 | 37,893 | 1,698 | 1.3 | 7.8 |
| 51 | Nevada | 1,202,593 | 11,948 | 1,011 | 1.0 | 4.6 |
| United States | 129,227,496 | 14,678,140 | 57,463 | 11.4 | 25.3 |
Ranked by share built 1939 or earlier. Margins of error are 90% (root sum of squares of the owner and renter cells). Share built before 1960 adds the 1940s and 1950s bins.
Source: [1] U.S. Census Bureau
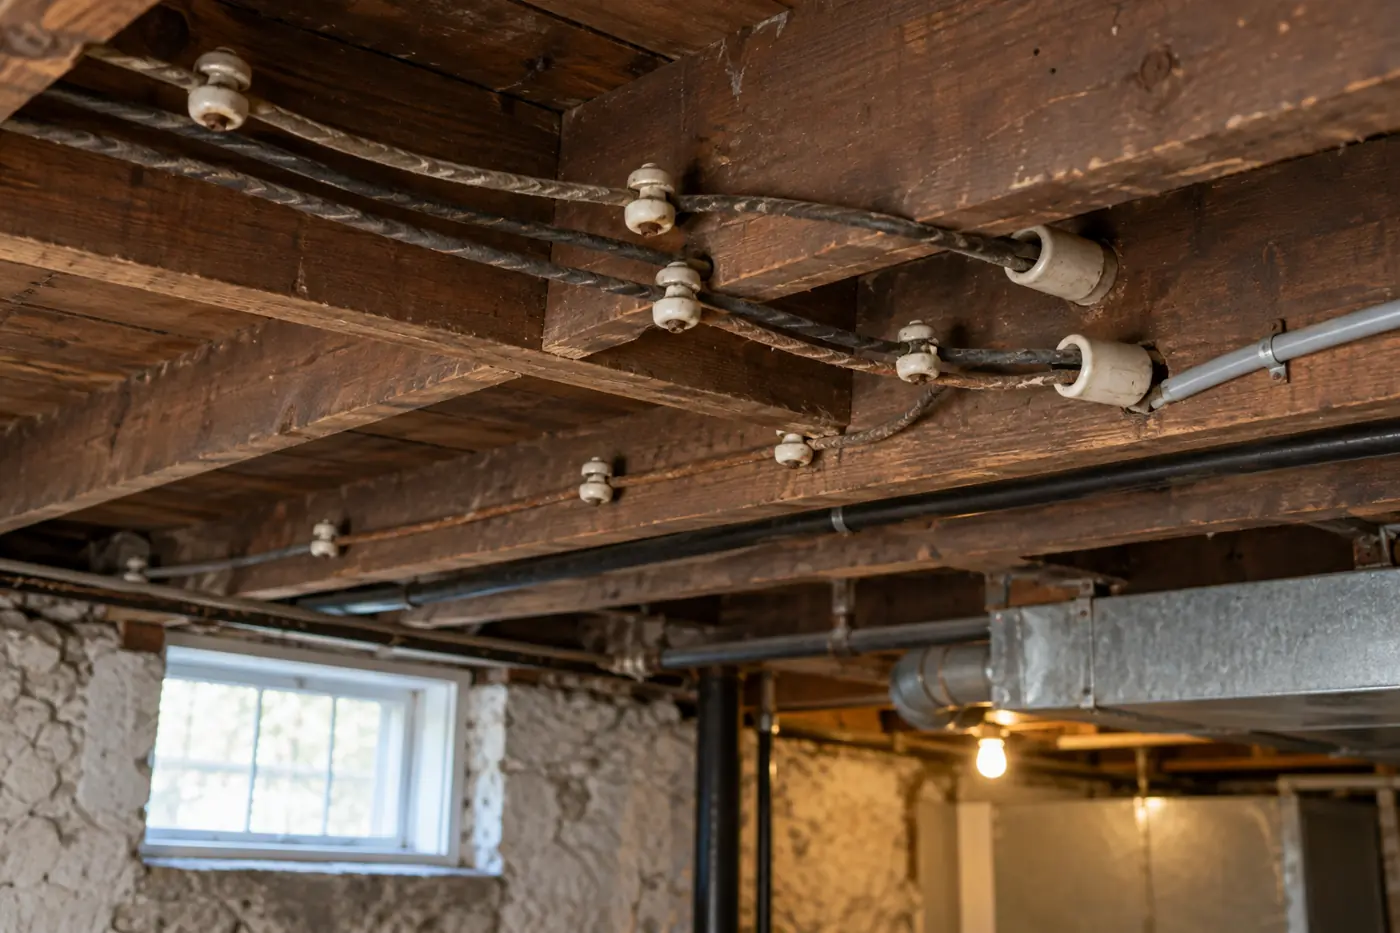
Knob-and-tube wiring: An early wiring method of single insulated copper conductors supported on porcelain knobs and passed through framing in porcelain tubes, with no ground conductor. Local agencies date its use to the 1940s (City of Menlo Park, City of Boston) or to homes built from 1880 to 1950 (Tacoma Power); a Pennsylvania state-funded study dates it to the mid 1950s.
Because some sources date knob-and-tube use into the 1950s, homes built before 1960 give an upper bound: 32,668,154 occupied homes, 25.3% of the US total, with DC (52.4%) and New York (51.9%) above half. Fire counts for older housing are covered in our electrical fire statistics report.
Homes built 1960 to 1979, the decades of aluminum wiring, number 30.9 million
Aluminum-era housing is spread far more evenly than pre-1940 housing. Shares range from 16.5% in DC to 35.5% in Hawaii, and the largest counts are in California, Texas and Florida.
Aluminum branch circuit wiring: Solid aluminum conductors used for general-purpose 15- and 20-ampere circuits (outlets, switches, lights), as opposed to the larger aluminum conductors used for service entrances, ranges and dryers, which CPSC's repair guidance does not cover. CPSC says branch circuit aluminum was installed between 1965 and the mid 1970s and that homes built before 1965 are unlikely to have it.
ACS year-built bins do not isolate 1965 to 1973, so this report uses the two decade bins that contain the era. In 2020-2024, 12,736,163 occupied US homes were built in the 1960s (9.9%) and 18,202,646 in the 1970s (14.1%), 30,938,809 in all (23.9%). The bins overstate the aluminum era: they include copper-wired homes from 1960 to 1964 and from the late 1970s.
California has 3,967,342 occupied homes built from 1960 to 1979, Texas 2,249,337 and Florida 2,036,533. By share, Hawaii (35.5%), California (29.3%) and Alaska (28.9%) rank highest; Nevada (16.9%) and DC (16.5%) rank lowest. The South holds 36.4% of US homes built from 1960 to 1979, against 15.3% of pre-1940 homes. The copper shortage CPSC cites for the switch to aluminum is tracked in our copper wire price index.
The two ACS decade bins that contain the 1965 to mid-1970s aluminum branch wiring era
Source: U.S. Census Bureau, American Community Survey 2020-2024, Table B25036. ECW Data Desk calculation.
Show all 52 rows
| Rank | State | Built 1960 to 1969 | Built 1970 to 1979 | Built 1960 to 1979 | Margin of error (+/-) | Share built 1960 to 1979 (%) |
|---|---|---|---|---|---|---|
| 1 | Hawaii | 66,974 | 107,873 | 174,847 | 3,111 | 35.5 |
| 2 | California | 1,695,884 | 2,271,458 | 3,967,342 | 16,401 | 29.3 |
| 3 | Alaska | 18,303 | 59,845 | 78,148 | 1,956 | 28.9 |
| 4 | Oklahoma | 167,197 | 273,124 | 440,321 | 4,331 | 28.2 |
| 5 | Louisiana | 196,506 | 305,184 | 501,690 | 6,331 | 27.8 |
| 6 | Connecticut | 187,464 | 199,379 | 386,843 | 5,004 | 27.0 |
| 7 | Mississippi | 119,519 | 189,794 | 309,313 | 4,448 | 27.0 |
| 8 | Michigan | 469,872 | 611,052 | 1,080,924 | 7,471 | 26.5 |
| 9 | Ohio | 575,346 | 687,878 | 1,263,224 | 8,882 | 26.0 |
| 10 | Oregon | 147,739 | 299,354 | 447,093 | 5,376 | 26.0 |
| 11 | Wyoming | 17,597 | 45,502 | 63,099 | 1,878 | 25.9 |
| 12 | Illinois | 581,425 | 719,126 | 1,300,551 | 9,469 | 25.8 |
| 13 | Alabama | 210,009 | 306,006 | 516,015 | 6,009 | 25.8 |
| 14 | Arkansas | 112,376 | 199,227 | 311,603 | 4,346 | 25.8 |
| 15 | Kentucky | 179,054 | 281,499 | 460,553 | 5,544 | 25.4 |
| 16 | New Mexico | 73,596 | 139,015 | 212,611 | 3,782 | 25.4 |
| 17 | New Jersey | 455,037 | 434,075 | 889,112 | 8,152 | 25.3 |
| 18 | Missouri | 275,027 | 359,002 | 634,029 | 6,543 | 25.3 |
| 19 | Nebraska | 82,236 | 118,979 | 201,215 | 2,958 | 25.2 |
| 20 | Maryland | 272,937 | 317,971 | 590,908 | 6,412 | 25.0 |
| 21 | North Dakota | 26,635 | 54,620 | 81,255 | 2,141 | 24.5 |
| 22 | Virginia | 334,825 | 478,445 | 813,270 | 6,608 | 24.2 |
| 23 | West Virginia | 63,498 | 112,826 | 176,324 | 3,262 | 24.2 |
| 24 | Iowa | 130,001 | 185,052 | 315,053 | 3,835 | 23.9 |
| 25 | Colorado | 181,110 | 381,705 | 562,815 | 6,039 | 23.7 |
| 26 | Kansas | 114,892 | 163,754 | 278,646 | 3,966 | 23.7 |
| 27 | Indiana | 284,183 | 356,286 | 640,469 | 6,303 | 23.6 |
| 28 | Wisconsin | 233,810 | 350,914 | 584,724 | 5,305 | 23.6 |
| 29 | Montana | 33,447 | 74,906 | 108,353 | 2,366 | 23.6 |
| 30 | Florida | 695,716 | 1,340,817 | 2,036,533 | 13,073 | 23.3 |
| 31 | Tennessee | 260,004 | 394,163 | 654,167 | 6,570 | 23.2 |
| 32 | Minnesota | 207,564 | 326,127 | 533,691 | 5,147 | 23.1 |
| 33 | New Hampshire | 45,335 | 82,804 | 128,139 | 2,670 | 23.1 |
| 34 | Rhode Island | 48,866 | 53,084 | 101,950 | 2,561 | 23.1 |
| 35 | Washington | 262,456 | 437,010 | 699,466 | 6,735 | 22.8 |
| 36 | Pennsylvania | 531,140 | 655,879 | 1,187,019 | 8,359 | 22.5 |
| 37 | Vermont | 22,275 | 38,905 | 61,180 | 1,670 | 22.4 |
| 38 | New York | 951,222 | 764,915 | 1,716,137 | 11,306 | 22.2 |
| 39 | South Dakota | 27,521 | 52,944 | 80,465 | 1,983 | 22.0 |
| 40 | Arizona | 178,476 | 433,503 | 611,979 | 6,612 | 21.4 |
| 41 | Idaho | 42,404 | 110,409 | 152,813 | 3,098 | 21.4 |
| 42 | Delaware | 39,689 | 46,283 | 85,972 | 2,528 | 21.4 |
| 43 | Massachusetts | 277,412 | 308,425 | 585,837 | 6,100 | 21.0 |
| 44 | Utah | 71,770 | 159,737 | 231,507 | 3,619 | 20.6 |
| 45 | Texas | 833,588 | 1,415,749 | 2,249,337 | 13,577 | 20.5 |
| 46 | South Carolina | 166,867 | 264,707 | 431,574 | 5,444 | 20.4 |
| 47 | Maine | 41,044 | 80,177 | 121,221 | 2,580 | 20.3 |
| 48 | North Carolina | 329,686 | 508,560 | 838,246 | 7,574 | 19.6 |
| 49 | Georgia | 300,985 | 483,302 | 784,287 | 7,611 | 19.2 |
| 50 | Nevada | 63,613 | 139,744 | 203,357 | 3,634 | 16.9 |
| 51 | District of Columbia | 32,031 | 21,551 | 53,582 | 2,272 | 16.5 |
| United States | 12,736,163 | 18,202,646 | 30,938,809 | 78,557 | 23.9 |
Ranked by share. The bins contain, but are wider than, the 1965 to mid-1970s aluminum branch wiring era described by CPSC.
Source: [1][9] U.S. Census Bureau; U.S. Consumer Product Safety Commission
Pennsylvania, Ohio and New York have the most pre-1940 homes per electrical contractor
The US has 176.1 occupied pre-1940 homes per electrical contractor establishment. Pennsylvania (461.6), Ohio (440.0) and New York (435.6) are highest among the states; Nevada (16.8) is lowest.
This ratio divides ACS 2020-2024 occupied pre-1940 homes by the 83,342 establishments in NAICS 238210 (electrical contractors and other wiring installation contractors) counted by County Business Patterns 2023. It shows where old housing stock is large relative to the local electrical trade, not how busy any firm is. The establishment counts themselves are tabulated in our electrical contractor counts by state.
The District of Columbia is an outlier at 4694.7 homes per establishment because CBP lists only 22 NAICS 238210 establishments in DC. CBP counts establishments by physical location, so firms based outside DC that work there are not counted in DC. DC is excluded from the chart. For homes built from 1960 to 1979 the US ratio is 371.2 homes per establishment.
Top 20 states; DC excluded (outlier). ACS 2020-2024 homes, CBP 2023 establishments
Source: U.S. Census Bureau, ACS 2020-2024 Table B25036 and County Business Patterns 2023 (NAICS 238210). ECW Data Desk calculation.
Show all 52 rows
| Rank | State | Occupied homes built 1939 or earlier | Electrical contractor establishments (2023) | Pre-1940 homes per establishment | 1960 to 1979 homes per establishment |
|---|---|---|---|---|---|
| 1 | District of Columbia | 103,284 | 22 | 4694.7 | 2435.5 |
| 2 | Pennsylvania | 1,269,313 | 2,750 | 461.6 | 431.6 |
| 3 | Ohio | 870,272 | 1,978 | 440.0 | 638.6 |
| 4 | New York | 2,279,316 | 5,232 | 435.6 | 328.0 |
| 5 | Illinois | 979,229 | 2,689 | 364.2 | 483.7 |
| 6 | West Virginia | 98,057 | 281 | 349.0 | 627.5 |
| 7 | Rhode Island | 127,851 | 383 | 333.8 | 266.2 |
| 8 | Iowa | 295,165 | 902 | 327.2 | 349.3 |
| 9 | Massachusetts | 843,709 | 2,640 | 319.6 | 221.9 |
| 10 | Indiana | 410,225 | 1,323 | 310.1 | 484.1 |
| 11 | Wisconsin | 437,776 | 1,459 | 300.1 | 400.8 |
| 12 | Michigan | 564,085 | 1,960 | 287.8 | 551.5 |
| 13 | Kansas | 166,104 | 681 | 243.9 | 409.2 |
| 14 | Missouri | 311,868 | 1,282 | 243.3 | 494.6 |
| 15 | Minnesota | 354,554 | 1,534 | 231.1 | 347.9 |
| 16 | Connecticut | 277,061 | 1,204 | 230.1 | 321.3 |
| 17 | New Jersey | 603,391 | 2,641 | 228.5 | 336.7 |
| 18 | Nebraska | 141,796 | 668 | 212.3 | 301.2 |
| 19 | Vermont | 67,857 | 324 | 209.4 | 188.8 |
| 20 | Maine | 132,342 | 662 | 199.9 | 183.1 |
| 21 | Oregon | 180,335 | 988 | 182.5 | 452.5 |
| 22 | Kentucky | 154,102 | 898 | 171.6 | 512.9 |
| 23 | Maryland | 232,977 | 1,444 | 161.3 | 409.2 |
| 24 | South Dakota | 54,333 | 341 | 159.3 | 236.0 |
| 25 | New Hampshire | 99,842 | 682 | 146.4 | 187.9 |
| 26 | Washington | 287,852 | 2,142 | 134.4 | 326.5 |
| 27 | Virginia | 213,790 | 1,826 | 117.1 | 445.4 |
| 28 | Delaware | 32,719 | 283 | 115.6 | 303.8 |
| 29 | California | 1,172,029 | 10,162 | 115.3 | 390.4 |
| 30 | Tennessee | 147,308 | 1,315 | 112.0 | 497.5 |
| 31 | Montana | 56,533 | 549 | 103.0 | 197.4 |
| 32 | North Dakota | 35,845 | 371 | 96.6 | 219.0 |
| 33 | Louisiana | 99,483 | 1,046 | 95.1 | 479.6 |
| 34 | Alabama | 88,053 | 1,013 | 86.9 | 509.4 |
| 35 | Mississippi | 41,490 | 478 | 86.8 | 647.1 |
| 36 | Oklahoma | 99,381 | 1,160 | 85.7 | 379.6 |
| 37 | Wyoming | 24,620 | 305 | 80.7 | 206.9 |
| 38 | Idaho | 54,110 | 750 | 72.1 | 203.8 |
| 39 | Colorado | 160,661 | 2,231 | 72.0 | 252.3 |
| 40 | South Carolina | 72,101 | 1,015 | 71.0 | 425.2 |
| 41 | North Carolina | 192,940 | 3,089 | 62.5 | 271.4 |
| 42 | Arkansas | 45,826 | 757 | 60.5 | 411.6 |
| 43 | Georgia | 147,988 | 2,491 | 59.4 | 314.8 |
| 44 | Utah | 66,833 | 1,136 | 58.8 | 203.8 |
| 45 | New Mexico | 33,622 | 604 | 55.7 | 352.0 |
| 46 | Texas | 314,263 | 6,124 | 51.3 | 367.3 |
| 47 | Hawaii | 15,962 | 363 | 44.0 | 481.7 |
| 48 | Florida | 165,734 | 6,492 | 25.5 | 313.7 |
| 49 | Arizona | 37,893 | 1,718 | 22.1 | 356.2 |
| 50 | Alaska | 4,312 | 244 | 17.7 | 320.3 |
| 51 | Nevada | 11,948 | 710 | 16.8 | 286.4 |
| United States | 14,678,140 | 83,342 | 176.1 | 371.2 |
ACS 2020-2024 occupied homes divided by CBP 2023 establishments in NAICS 238210. DC's ratio reflects its small establishment count, not a shortage of contractors serving it.
What CPSC has found about aluminum wiring, 1974 to 2011
The Consumer Product Safety Commission is the federal agency with a standing position on aluminum branch wiring. Its 2011 guidance treats failing connections as a fire hazard and names only three permanent repairs.
CPSC Publication 516 (June 2011) reports that a national survey by Franklin Research Institute for CPSC found homes built before 1972 and wired with aluminum were 55 times more likely than copper-wired homes to have one or more outlet connections reach Fire Hazard Conditions. The survey defined that as a cover plate screw reaching 149 degrees C (300 degrees F), sparks, or charring. It covered outlet connections only and developed no data for aluminum-wired homes built after 1972.
- April 28, 1974: two people died in a home in Hampton Bays, N.Y.; fire officials attributed the fire to an overheating aluminum wire connection at a wall receptacle (CPSC Publication 516).
- 1946: Underwriters Laboratories listed aluminum wire for interior wiring, but it was not used heavily until 1965 (IAEI Magazine, January/February 2006).
- 1972: AA-8000 series aluminum alloy building wire began to be listed and manufactured; pre-1972 wire is the older AA-1350 alloy (IAEI).
- 1978: UL issued a connector standard for aluminum building wire with more rigorous tests (IAEI).
- 1981 and 1987: the NEC required aluminum alloy conductors for 12 to 8 AWG branch circuits from 1981 and first specifically required AA-8000 series conductors in 1987 (IAEI).
- May 22, 1996: CPSC release 96-129 described older homes as the most vulnerable to electrical wiring fires and announced the rewiring of 4 older homes to test low-cost fixes.
- June 2011: CPSC Publication 516 approved 3 permanent repairs: full replacement with copper, the COPALUM crimp connector and the AlumiConn connector. It called CO/ALR devices at best an incomplete repair and twist-on pigtails a temporary one.
CPSC also states that failing aluminum connections seldom give warning signs, lists hot faceplates, flickering lights, dead circuits and the smell of burning plastic as signs of a problem, and tells homeowners not to attempt repairs themselves. CPSC says copper rewiring is the best method but that for many homes it is impractical or prohibitively expensive.
Is knob and tube wiring dangerous? What federal, state and city records say
No federal agency publishes a knob-and-tube fire rate. The records that exist point to alterations, overfusing and buried insulation as the hazards, more than the original wiring.
A CPSC study of 149 investigated residential electrical distribution fires, published in Fire Journal in January/February 1990 and reproduced in the Pennsylvania DCED and Penn College study (January 2004), attributed 3 fires (2.0%) to knob and tube wiring encapsulated in insulation. Improper alterations were a contributing factor in 55 fires (37%), and 86 of the 149 fires (57.7%) were in dwellings over 40 years old. The table notes that these fires were not a probability sample.
The same study reported that the fire rate in dwellings over 40 years old was 1.5 times that of dwellings 21 to 40 years old and about 3 times that of dwellings 11 to 20 years old. The Pennsylvania authors concluded that the safety concerns were mainly the alterations made to original knob and tube wiring, with heat-damaged ceiling fixtures as an exception.
Insulation is the main regulatory issue. A 1987 amendment to the National Electrical Code prohibited placing insulation in contact with knob and tube wiring (NASCSP WAPTAC). A DOE Weatherization Assistance Program memo dated October 21, 1988 left the decision to state and local codes and named Massachusetts, Nebraska and Washington as states that allowed insulation after a licensed electrician's survey. Menlo Park, California still allows insulation only after certification by a state-licensed electrical contractor, and Tacoma Power requires a licensed electrician's inspection report before insulating.
In a Pennsylvania weatherization caseload reviewed in summer 2002, 23 of 190 jobs (12.1%) had existing knob and tube wiring. Vermont's weatherization program, which completed 1,310 homes in state fiscal year 2025, lists knob and tube among conditions that can prohibit weatherization (report of January 30, 2026). The U.S. Fire Administration's electrical safety page does not mention knob and tube or aluminum wiring; it advises never forcing a 3-prong cord into a 2-slot outlet. Code adoption differs by state; see our code section and NEC adoption by state.
Homes built before 1940 report exposed wiring 1.8 times as often as homes built since 2000
In the 2023 American Housing Survey, 14.9% of occupied homes built before 1940 reported exposed wiring, a room without a working outlet or a recently blown fuse or breaker, against 10.2% of homes built in 2000 or later.
The American Housing Survey (AHS), a HUD and Census Bureau survey run every two years, asks about three electrical items. In 2023, 3,721 thousand occupied homes (2.8%) had exposed wiring in finished living areas, 2,247 thousand (1.7%) had a room without a working wall outlet, and 10,429 thousand (7.8% of wired homes) had a fuse blow or breaker trip in the prior three months (AHS 2023 published estimates).
Tabulating the AHS 2023 public use file by year built shows a gradient. Exposed wiring was reported in 4.0% (plus or minus 0.6 points) of homes built in 1939 or earlier, against 2.2% (plus or minus 0.3) of homes built in 2000 or later. Rooms without a working outlet: 2.5% against 1.3%. Blown fuses or tripped breakers: 10.1% against 7.4%. Each gap is statistically significant at the 90% level using the AHS generalized variance function.
Homes built from 1960 to 1979 sit in between: 3.0% report exposed wiring and 11.8% any of the three problems, against 10.2% for homes built since 2000. Their blown-fuse rate (7.9%) is not significantly different from the newest homes. The AHS definitions caution that blown fuses may reflect inadequate wiring but also happen when new occupants overload circuits.
Percent of occupied homes (blown fuses: percent of homes with wiring)
Source: U.S. Census Bureau and HUD, American Housing Survey 2023 national public use file. ECW Data Desk tabulation.
| Year built | Occupied homes (thousands) | Exposed wiring (%) | +/- | Room without working outlet (%) | +/- | Fuse or breaker blown, last 3 months (%) | +/- | Any of the three (%) | +/- |
|---|---|---|---|---|---|---|---|---|---|
| 1939 or earlier | 16,267 | 4.0 | 0.6 | 2.5 | 0.5 | 10.1 | 0.9 | 14.9 | 1.0 |
| 1940 to 1959 | 18,046 | 3.0 | 0.5 | 1.7 | 0.4 | 8.2 | 0.8 | 11.7 | 0.9 |
| 1960 to 1979 | 32,424 | 3.0 | 0.4 | 2.0 | 0.3 | 7.9 | 0.6 | 11.8 | 0.7 |
| 1960 to 1969 | 13,487 | 2.9 | 0.5 | 1.8 | 0.4 | 7.8 | 0.9 | 11.5 | 1.0 |
| 1970 to 1979 | 18,936 | 3.1 | 0.5 | 2.1 | 0.4 | 8.0 | 0.7 | 12.1 | 0.9 |
| 1980 to 1999 | 33,706 | 2.4 | 0.3 | 1.3 | 0.2 | 6.9 | 0.5 | 10.0 | 0.6 |
| 2000 or later | 32,787 | 2.2 | 0.3 | 1.3 | 0.2 | 7.4 | 0.5 | 10.2 | 0.6 |
| All occupied | 133,231 | 2.8 | 0.2 | 1.7 | 0.1 | 7.8 | 0.3 | 11.3 | 0.3 |
ECW tabulation of the AHS 2023 national public use file using the full-sample weight. Plus or minus values are 90% margins of error from the AHS generalized variance function (b = 5.18). Blown fuses are a percent of homes with wiring.
Source: [5][7][8] U.S. Census Bureau and U.S. Department of Housing and Urban Development; U.S. Census Bureau and U.S. Department of Housing and Urban Development; U.S. Census Bureau
How much does it cost to rewire a house? Survey medians and public program caps
No federal source publishes an average whole-house rewiring cost. The public record offers a national survey of what owners spent on electrical jobs and the caps that weatherization programs set for knob and tube work.
AHS 2023 Table C-16-OO counts 6,595 thousand electrical wiring, fuse box, breaker panel or built-in lighting projects in owner-occupied homes in the two years before the 2023 interview, with a median cost of $1,000 and a mean of $2,907. These are mostly partial jobs, not whole-house rewires.
Older homes spend more and do more of this work. The median project in homes built in 1939 or earlier cost $1,500 (hired work: $2,100), against $700 (hired: $1,200) in homes built in 2000 or later, a ratio of 1.75 for hired work. Pre-1940 homes reported 9.9 electrical projects per 100 owner-occupied homes in two years, against 4.9 for the newest homes and 7.6 nationally (ECW tabulation of the AHS 2023 public use file).
Programs that pay for knob and tube work set caps rather than averages. Iowa's weatherization program allows up to $15,000 per owner-occupied home to replace knob and tube wiring (rules revised July 25, 2025). Minnesota's WIRE Access Project targets a $20,000 average per unit for roof and electrical upgrades. Mass Save offers up to $7,000 for weatherization barriers including knob and tube, and BayREN's 2026 rebate pays up to $2,000 to remediate active knob and tube or $300 to certify it inactive. The Pennsylvania study recorded contractor bids of $706 to $2,477 in 2002 to replace a single knob and tube feed line, about $1,263 to $4,433 in 2025 dollars using CPI-U.
Owner-occupied homes, jobs in the two years before the 2023 AHS interview
Source: U.S. Census Bureau and HUD, American Housing Survey 2023 project file. ECW Data Desk tabulation.
| Year built | Projects in two years (thousands) | Sample projects | Median cost, all ($) | Mean cost, all ($) | Median cost, hired ($) | Done by household (%) |
|---|---|---|---|---|---|---|
| 1939 or earlier | 947 | 305 | 1,500 | 3,570 | 2,100 | 28.3 |
| 1940 to 1959 | 1,052 | 341 | 1,000 | 3,297 | 1,900 | 32.3 |
| 1960 to 1979 | 1,805 | 561 | 1,000 | 2,825 | 1,500 | 31.3 |
| 1980 to 1999 | 1,711 | 561 | 960 | 2,803 | 1,500 | 33.1 |
| 2000 or later | 1,080 | 329 | 700 | 2,242 | 1,200 | 30.9 |
| All owner-occupied | 6,595 | 2097 | 1,000 | 2,905 | 1,500 | 31.4 |
Owner-occupied homes; jobs in the two years before the 2023 interview. Costs are rounded and topcoded on the public file. Hired = not done by the household. Medians from small samples carry wide uncertainty; no margin of error is computed. The all-homes mean is 2,905 on the public file against 2,907 in the published table.
Source: [5][6] U.S. Census Bureau and U.S. Department of Housing and Urban Development; U.S. Census Bureau
| Program or study | Where | Date | Dollar figure | What the figure is |
|---|---|---|---|---|
| AHS 2023, electrical wiring, fuse box and breaker projects | United States | Jobs in the two years before the 2023 interview | $1,000 median; $2,907 mean | Reported spending per project, all sizes, including do-it-yourself |
| Iowa Weatherization, Knob & Tube Special Project Funds | Iowa | Rules revised July 25, 2025 | $15,000 maximum per home | Program cap to replace knob and tube in owner-occupied homes |
| Iowa Weatherization Readiness Funds | Iowa | Rules revised July 25, 2025 | $20,000 maximum per home | Cap for any repair that would otherwise defer weatherization |
| Minnesota WIRE Access Project | Minnesota | Updated July 1, 2025 | $20,000 goal average per unit | Roof and electrical-system upgrades, including knob and tube replacement and panel upgrades |
| Mass Save Enhanced Incentives, barrier mitigation | Massachusetts | Accessed October 27, 2026 | $7,000 maximum | Incentive for weatherization barriers including knob and tube; income verified |
| BayREN EASE Home rebate | San Francisco Bay Area | Announced June 15, 2026 | $2,000 maximum; $300 certification | Rebate to remediate active knob and tube, or certify it inactive |
| Pennsylvania DCED and Penn College study | Pennsylvania | Field work 2002, report January 2004 | $706 to $2,477 ($1,263 to $4,433 in 2025 dollars) | Contractor bids to replace a single knob and tube feed line, six case-study homes |
Program figures are caps or incentive amounts, not average costs. Pennsylvania figures converted with CPI-U annual averages (2002: 179.9; 2025: 321.943).
Source: [6][14][15][17][16][11][25] U.S. Census Bureau; Iowa Department of Health and Human Services; Minnesota Department of Commerce, Weatherization Assistance Program; City of Boston; Association of Bay Area Governments (BayREN); Weatherization Training Center, Pennsylvania College of Technology; U.S. Bureau of Labor Statistics
Published contractor and marketplace price ranges are not used as figures here because they do not publish methods. Panel replacement often accompanies rewiring; see our electrical panel upgrade cost report.
Knob and tube wiring insurance and inspection: what insurers and cities put in writing
No state regulator statement on knob and tube coverage was found. Insurer documents show the wiring is recorded at underwriting, and news reporting describes declines and cancellations.
Florida's Citizens Property Insurance Corporation uses a 4-point inspection form (version Insp4pt 03 25) that asks a Florida-licensed inspector to indicate active knob and tube, cloth wiring and branch circuit aluminum wiring. If single strand aluminum is present, the form requires separate documentation of remediation certified by a licensed electrician and has check boxes for COPALUM and AlumiConn repairs, the two connector methods CPSC approves. Citizens states that underwriting uses the form to determine insurability.
Progressive's consumer guidance (updated August 15, 2023) says some insurers may not offer a policy for a home with knob and tube or aluminum wiring, and that those that do may charge more or require an inspection report. ABC7 San Francisco reported on March 13, 2025 that insurers were declining and cancelling Bay Area policies over knob and tube wiring; the San Francisco Fire Department told the station it had not seen trends in knob and tube residential structure fires.
How we ranked the states
Share of occupied homes built before 1940, by state (knob-and-tube exposure)
Formula(B25036_012 + B25036_023) / B25036_001 x 100
Inputs: fact sheet rows for each state's pre-1940 and occupied counts (see derived_metrics.csv) (fact sheet rows)
Result: US 11.4%; highest DC 31.8% and Massachusetts 30.3%; lowest Nevada 1.0%
Older Northeast and Midwest cities carry most pre-1940 housing; Sun Belt states built most of their stock after 1960.
Limitations: Exposure only: rewired homes are counted. Year built is self-reported and coarse for the oldest homes.
Share of occupied homes built 1960 to 1979, by state (aluminum-era exposure)
Formula(1960s + 1970s owner and renter cells) / occupied x 100
Inputs: B25036 lines 008, 009, 019, 020 and 001 by state (fact sheet rows)
Result: US 23.9%; highest Hawaii 35.5%; lowest DC 16.5%
Exposure to the aluminum era is national; the largest counts are in California, Texas and Florida.
Limitations: The bins include 1960 to 1964 and the late 1970s, when most homes were wired with copper.
Electrical problem rates, pre-1940 homes vs homes built since 2000 (AHS 2023)
Formularate A / rate B; significant at 90% if |A - B| > sqrt(MOE_A^2 + MOE_B^2)
Inputs: AHS 2023 PUF tabulations and GVF parameter b = 5.18 (fact sheet rows)
Result: Exposed wiring 1.8 times; any of the three problems 1.5 times; all gaps significant
Older homes report more visible electrical deficiencies, consistent with older or altered wiring.
Limitations: Self-reported items; not a measure of wiring type; GVF margins are approximations.
Pre-1940 homes per electrical contractor establishment, by state
FormulaACS 2020-2024 pre-1940 occupied homes / CBP 2023 NAICS 238210 establishments
Inputs: fact sheet state rows for pre-1940 homes and establishments (fact sheet rows)
Result: US 176.1; Pennsylvania 461.6; Ohio 440.0; Nevada 16.8
Rust Belt states have the most old housing per local electrical firm, a pointer to where rewiring demand is large relative to trade capacity.
Limitations: Establishments are not licenses or electricians; firms cross state lines (DC outlier); periods differ.
Regional concentration of pre-1940 housing
Formularegion pre-1940 homes / US pre-1940 homes, compared with region share of occupied homes
Inputs: state rows summed by Census region (fact sheet rows)
Result: Northeast and Midwest: 70.3% of pre-1940 homes vs 39.1% of occupied homes; top five states 44.8%
Knob-and-tube exposure is regional; national averages understate it in the Northeast and Midwest.
Limitations: Sum of rounded regional shares.
Electrical projects per 100 owner-occupied homes by year built
Formulaweighted electrical wiring projects (JOBTYPE 23) / owner-occupied homes x 100
Inputs: AHS 2023 project and household files (fact sheet rows)
Result: 9.9 in pre-1940 homes vs 4.9 in homes built since 2000; US 7.6
Owners of the oldest homes undertake electrical work about twice as often as owners of the newest homes.
Limitations: Two-year recall window; includes lighting and panel jobs, not only rewiring.
Pennsylvania knob and tube feed replacement bids in 2025 dollars
Formula2002 bid x (CPI-U 2025 / CPI-U 2002)
Inputs: rows for $706, $2,477 and CPI-U 179.9 and 321.943 (fact sheet rows)
Result: $1,263 to $4,433 per feed line
Even a single circuit replacement in an occupied old home ran into four figures in today's dollars.
Limitations: Six case-study homes in one state; CPI-U is general inflation, not electrical labor cost.
State by state
- 14,678,140 occupied US homes were built in 1939 or earlier, 11.4% of 129,227,496 occupied homes (ACS 2020-2024).[1]
- The ACS 2024 1-year estimate puts pre-1940 occupied homes at 14,739,173, or 11.1% (United States, 2024).[2]
- 30,938,809 occupied US homes were built from 1960 to 1979, 23.9% of occupied homes (ACS 2020-2024).[1]
- The District of Columbia (31.8%), Massachusetts (30.3%), New York (29.5%) and Rhode Island (29.0%) have the highest shares of occupied homes built before 1940; Nevada has the lowest at 1.0% (ACS 2020-2024).[1]
- New York has 2,279,316 occupied pre-1940 homes, the most of any state, followed by Pennsylvania with 1,269,313 (ACS 2020-2024).[1]
- The Northeast and Midwest hold 70.3% of US occupied pre-1940 homes and 39.1% of all occupied homes (ACS 2020-2024, Census regions).[1]
- Hawaii has the highest share of occupied homes built from 1960 to 1979 (35.5%); California has the largest count, 3,967,342 (ACS 2020-2024).[1]
- Renters occupy 38.4% of US occupied pre-1940 homes; 12.5% of renter-occupied homes were built before 1940, against 10.7% of owner-occupied homes (ACS 2020-2024).[1]
- CPSC reports that homes built before 1972 and wired with aluminum were 55 times more likely than copper-wired homes to have one or more outlet connections reach Fire Hazard Conditions (Publication 516, June 2011).[9]
- CPSC says homes built before 1965 are unlikely to have aluminum branch circuit wiring and that cables installed from 1965 to the mid 1970s may contain it (Publication 516, June 2011).[9]
- In the 2023 AHS, 4.0% of occupied homes built before 1940 reported exposed wiring, against 2.2% of homes built in 2000 or later, a ratio of 1.8 (United States).[5][8]
- Nationally, 3,721 thousand occupied homes reported exposed wiring and 10,429 thousand reported a fuse or breaker blown in the prior three months (AHS 2023).[6]
- The median electrical wiring, fuse box or breaker project in owner-occupied homes cost $1,000 and the mean $2,907, for jobs in the two years before the 2023 AHS interview (United States).[6]
- The US had 176.1 occupied pre-1940 homes per electrical contractor establishment; Pennsylvania had 461.6, the most of any state (ACS 2020-2024, CBP 2023).[1][4]
- In a CPSC study of 149 investigated residential electrical fires published in 1990, 3 (2.0%) were attributed to knob and tube wiring encapsulated in insulation and 55 (37%) involved improper alterations.[11]
In short
- 14.7 million occupied US homes (11.4%) were built in 1939 or earlier, the knob-and-tube era, according to the ACS 2020-2024 5-year estimates.
- 30.9 million occupied homes (23.9%) were built from 1960 to 1979, the two decades containing the 1965 to mid-1970s aluminum branch wiring era that CPSC describes.
- Pre-1940 housing is regional: the Northeast and Midwest hold 70.3% of it but only 39.1% of all occupied homes. Five states (New York, Pennsylvania, California, Illinois, Ohio) hold 44.8%.
- CPSC's standing finding: pre-1972 aluminum-wired homes were 55 times more likely than copper-wired homes to have an outlet connection reach Fire Hazard Conditions (Publication 516, June 2011).
- In the 2023 American Housing Survey, 14.9% of homes built before 1940 reported exposed wiring, a room without a working outlet or a recently blown fuse, against 10.2% of homes built since 2000.
- Owners of pre-1940 homes reported 9.9 electrical wiring projects per 100 homes in two years, against 4.9 for homes built since 2000; the national median project cost was $1,000 (AHS 2023).
- No federal source counts homes that still have either wiring type or publishes an average rewiring cost; public programs publish caps, such as Iowa's $15,000 per home for knob and tube replacement.
What people search for
When did they stop using aluminum wiring?
Solid aluminum branch circuit wiring of the older AA-1350 type was installed in US homes from about 1965 to the mid 1970s, according to CPSC Publication 516 (June 2011). It was never banned: AA-8000 series aluminum alloy building wire has been listed and manufactured since 1972, the NEC has required aluminum alloy conductors for 12 to 8 AWG branch circuits since 1981, and it first specifically required AA-8000 series conductors in 1987 (IAEI Magazine, 2006). In 2020-2024, 30,938,809 occupied US homes dated from 1960 to 1979 (ACS).
When did they stop using knob and tube wiring?
Sources differ. The City of Menlo Park and the City of Boston say knob and tube was used until the 1940s; Tacoma Power describes it as the standard method in homes built from 1880 to 1950; a Pennsylvania state-funded study (January 2004) says it continued up to the mid 1950s. In 2020-2024, 14,678,140 occupied US homes were built before 1940 and 32,668,154 before 1960 (ACS).
Is knob and tube wiring dangerous?
No federal agency publishes a knob and tube fire rate. In a CPSC study of 149 investigated residential electrical fires (published 1990), 3 fires (2.0%) were attributed to knob and tube encapsulated in insulation, while improper alterations contributed to 55 (37%). A 1987 NEC amendment prohibited insulation in contact with knob and tube wiring, and cities such as Menlo Park require a licensed electrical contractor's certification before insulating. Fire counts for electrical causes are in our electrical fire statistics report.
Will insurance cover knob and tube wiring?
It depends on the insurer; no state regulator statement was found. Progressive (August 15, 2023) says some insurers may not offer a policy for homes with knob and tube or aluminum wiring and others may charge more or require an inspection report. Florida's Citizens Property Insurance 4-point form (March 2025 version) asks inspectors to record active knob and tube and branch circuit aluminum wiring. ABC7 reported Bay Area declines and cancellations on March 13, 2025. This is not insurance advice.
How much does it cost to rewire a house?
No federal source publishes an average whole-house rewiring cost. The AHS 2023 reports a median of $1,000 and a mean of $2,907 for electrical wiring, fuse box and breaker projects in owner-occupied homes, mostly partial jobs; hired projects in pre-1940 homes had a median of $2,100. Programs publish caps: Iowa allows up to $15,000 per home for knob and tube replacement and Minnesota targets a $20,000 average per unit for roof and electrical upgrades.
Common questions
How many US homes have knob and tube wiring?
No federal survey counts them. The exposure is 14,678,140 occupied homes built in 1939 or earlier, 11.4% of US occupied homes (ACS 2020-2024). Many have been rewired since, so the true number with active knob and tube is lower.
Which states have the most homes built before 1940?
By count, New York (2,279,316), Pennsylvania (1,269,313) and California (1,172,029) lead. By share, DC (31.8%), Massachusetts (30.3%) and New York (29.5%) are highest (ACS 2020-2024).
Which states have the most homes from the aluminum wiring era?
California has 3,967,342 occupied homes built from 1960 to 1979, the most of any state, followed by Texas with 2,249,337 and Florida with 2,036,533. Hawaii has the highest share at 35.5% (ACS 2020-2024).
Is aluminum wiring dangerous?
CPSC reports that homes built before 1972 and wired with aluminum were 55 times more likely than copper-wired homes to have an outlet connection reach Fire Hazard Conditions, and recommends a permanent repair by a qualified electrician (Publication 516, June 2011).
What years was aluminum wiring used in houses?
CPSC says aluminum branch circuit wiring was installed from 1965 to the mid 1970s and that homes built before 1965 are unlikely to have it. In 2020-2024, 12,736,163 occupied homes were built in the 1960s and 18,202,646 in the 1970s (ACS).
Is aluminum wiring still allowed by code?
Yes. AA-8000 series aluminum alloy building wire has been listed and manufactured since 1972, and the NEC first specifically required AA-8000 series conductors in 1987 (IAEI Magazine, 2006). The hazards CPSC describes concern older pre-1972 AA-1350 branch circuit wire.
What repairs does CPSC approve for aluminum wiring?
As of June 2011, CPSC approved 3 permanent repairs: full replacement with copper, the COPALUM crimp connector and the AlumiConn connector. CPSC staff called CO/ALR devices at best an incomplete repair and told homeowners not to do the work themselves.
Do older homes report more electrical problems?
Yes. In the 2023 AHS, 14.9% of occupied homes built before 1940 reported exposed wiring, a room without a working outlet or a blown fuse in the prior three months, against 10.2% of homes built in 2000 or later and 11.3% of all occupied homes.
Can insulation be installed over knob and tube wiring?
A 1987 NEC amendment prohibited insulation in contact with knob and tube wiring, but adoption is state and local. A DOE memo of October 21, 1988 named Massachusetts, Nebraska and Washington as allowing insulation after a licensed electrician's survey; Menlo Park and Tacoma Power require a licensed electrician's certification or inspection first.
Are there programs that help pay to replace knob and tube wiring?
Yes, in some states. Iowa's weatherization program allows up to $15,000 per owner-occupied home, Mass Save offers up to $7,000 for weatherization barriers including knob and tube, and BayREN's 2026 rebate pays up to $2,000 for remediation (program documents dated 2025 and 2026).
Get the data
Every table in this report is available as a CSV under CC BY 4.0. The fact sheet lists each value with its source URL and access date.
- derived_metrics.csv (CSV)
- fact_sheet.csv (CSV)
- Occupied homes built before 1940 by state, 2020-2024 (CSV)
- Occupied homes built 1960 to 1979 by state, 2020-2024 (CSV)
- Pre-1940 and 1960 to 1979 homes per electrical contractor establishment by state (CSV)
- Electrical problems in occupied homes by year built, AHS 2023 (CSV)
- Electrical wiring, fuse box and breaker projects by year built, AHS 2023 (CSV)
- Rewiring and knob and tube cost reference points from public programs and studies (CSV)
Cite this report
The figures to cite first
- 14.7 million occupied US homes (11.4%) were built before 1940 and 30.9 million (23.9%) from 1960 to 1979 (Census ACS 2020-2024).[1]
- CPSC: pre-1972 aluminum-wired homes were 55 times more likely than copper-wired homes to have an outlet connection reach Fire Hazard Conditions.[9]
- In 2023, 14.9% of homes built before 1940 reported an electrical problem in the AHS, against 10.2% of homes built since 2000.[5][8]
Quotable figures
- 14.7 million occupied US homes were built before 1940, the knob-and-tube era, 11.4% of occupied homes (Census ACS 2020-2024).[1]
- 30.9 million occupied US homes were built from 1960 to 1979, the decades containing the aluminum branch wiring era (Census ACS 2020-2024).[1]
- The Northeast and Midwest hold 70.3% of US pre-1940 homes but only 39.1% of occupied homes (ACS 2020-2024).[1]
- CPSC: pre-1972 aluminum-wired homes were 55 times more likely than copper-wired homes to have an outlet connection reach Fire Hazard Conditions (June 2011).[9]
- Homes built before 1940 reported exposed wiring 1.8 times as often as homes built since 2000 (4.0% vs 2.2%, AHS 2023).[5][8]
- Pennsylvania has 461.6 occupied pre-1940 homes per electrical contractor establishment, against 176.1 nationally (ACS 2020-2024, CBP 2023).[1][4]
- Owners of pre-1940 homes reported 9.9 electrical wiring projects per 100 homes in two years, double the 4.9 in homes built since 2000 (AHS 2023).[5]
Summary for editors
No federal survey counts the US homes that still have knob-and-tube or aluminum branch wiring, but Census data show how much housing is old enough to have it. An Electrical Contractors and Wiring Data Desk analysis of the American Community Survey 2020-2024 finds 14.7 million occupied homes built before 1940, the knob-and-tube era, and 30.9 million built from 1960 to 1979, the decades containing the aluminum wiring era. Pre-1940 homes are concentrated in the Northeast and Midwest, which hold 70.3% of them; DC, Massachusetts and New York have the highest shares. The Consumer Product Safety Commission reports that pre-1972 aluminum-wired homes were 55 times more likely than copper-wired homes to have an outlet connection reach Fire Hazard Conditions. In the 2023 American Housing Survey, homes built before 1940 reported exposed wiring 1.8 times as often as homes built since 2000. Public programs cap knob and tube replacement funding, for example at $15,000 per home in Iowa.
Headlines the data supports
- 14.7 million US homes were built in the knob-and-tube era
- Aluminum wiring era homes: 30.9 million built from 1960 to 1979
- Northeast and Midwest hold 70.3% of America's pre-1940 homes
- Pre-1940 homes report exposed wiring 1.8 times as often as newer homes
- Pennsylvania has 461.6 pre-1940 homes per electrical contractor
Citation
Electrical Contractors and Wiring. (2026). Aluminum wiring and knob-and-tube wiring: how many US homes are old enough, by state. Retrieved from https://electricalcontractorsandwiring.com/data/aluminum-and-knob-and-tube-wiring/
Reuse
Data and tables are licensed CC BY 4.0. Attribution: “Source: Electrical Contractors and Wiring, Aluminum wiring and knob-and-tube wiring: how many US homes are old enough, by state” with a link to this page.
How we built this report
Question and scope. This report counts US housing old enough to have been built with knob-and-tube or aluminum branch circuit wiring. It does not estimate how many homes still have either: no federal survey asks about wiring method, and homes are rewired over time. Counts are therefore exposure, not prevalence.
Year-built counts. State and national counts come from the ACS 2020-2024 5-year estimates, Table B25036 (tenure by year structure built, occupied housing units), downloaded from the Census Bureau's table-based summary file (data files dated 2026-01-29). The 5-year release is used for state comparisons because it has smaller margins of error than the 1-year release; the ACS 2024 1-year national figure is shown as a cross-check. Margins of error for summed cells are the root sum of squares of the published 90% margins. The Census API now requires a key, so no API was used. The ACS 2025 1-year estimates were not posted on 2026-10-27.
Era definitions. Knob-and-tube exposure uses homes built in 1939 or earlier, the oldest ACS bin; because some sources date the method into the 1950s, homes built before 1960 are shown as an upper bound. Aluminum-era exposure uses the 1960 to 1969 and 1970 to 1979 bins, which contain but are wider than the 1965 to mid-1970s period CPSC describes.
Housing survey tabulations. Electrical problem rates and project costs by year built are ECW tabulations of the AHS 2023 national public use file (v1.1) using the full-sample weight; project records were joined to household weights by control number. National totals match the Census Bureau's published verification estimates (exposed wiring 3,721 thousand; electrical projects 6,595 thousand; median $1,000). Margins of error for percentages use the generalized variance function in the 2023 AHS sample design document (b = 5.18 for total occupied units); differences are called significant when they exceed the square root of the sum of squared margins. Project medians have no computed margin of error.
Contractor ratio. Pre-1940 homes per establishment divides ACS occupied pre-1940 homes by County Business Patterns 2023 establishments in NAICS 238210, the latest CBP year posted. Establishments are business locations with payroll, not licenses or individual electricians.
Sources and exclusions. Federal statistical files, federal agency publications (CPSC, DOE, USFA), state and city program documents and one state-funded study form the evidence base. Insurer documents and one news report are used only for the insurance section. Vendor and marketplace rewiring price ranges were excluded because they publish no method (see excluded.md). Fire counts are not repeated; they are covered in the site's electrical fire statistics report. The 2002 Pennsylvania bids are converted to 2025 dollars with CPI-U annual averages.
Conflicts and limitations. Sources disagree on when knob-and-tube ended (1940s to mid 1950s); all dates are shown with their sources. AHS and ACS give different counts of pre-1940 homes (16.3 million vs 14.7 million) because of different samples and reference periods. The 1990 CPSC fire study and the 2002 Pennsylvania study are old and small and are cited for what they found, not as current rates. Last updated 2026-10-27.
This report presents published data with its limitations. It is not legal, financial or investment advice.
Sources by tier
Tier 1: primary and official sources (22)
- [1] U.S. Census Bureau. American Community Survey 2020-2024 5-year estimates, Table B25036 Tenure by Year Structure Built (table-based summary file, data files dated 2026-01-29). 2020 to 2024 (5-year period estimate). Accessed 2026-10-27.
- [2] U.S. Census Bureau. American Community Survey 2024 1-year estimates, Table B25036 Tenure by Year Structure Built (table-based summary file). 2024. Accessed 2026-10-27.
- [3] U.S. Census Bureau. American Community Survey 2020-2024 5-year estimates, Table B25034 Year Structure Built (all housing units). 2020 to 2024. Accessed 2026-10-27.
- [4] U.S. Census Bureau. County Business Patterns 2023, state file (cbp23st), NAICS 238210 Electrical Contractors and Other Wiring Installation Contractors. 2023 (March 12 pay period). Accessed 2026-10-27.
- [5] U.S. Census Bureau and U.S. Department of Housing and Urban Development. American Housing Survey 2023 National Public Use File v1.1 (household and project files). 2023 survey. Accessed 2026-10-27.
- [6] U.S. Census Bureau. AHS 2023 Table Specifications and PUF Estimates for User Verification (Housing Quality; Home Improvement Costs, Table C-16-OO). 2023 survey. Accessed 2026-10-27.
- [7] U.S. Census Bureau and U.S. Department of Housing and Urban Development. American Housing Survey for the United States: 2023, Appendix A Definitions. 2023 survey. Accessed 2026-10-27.
- [8] U.S. Census Bureau. 2023 AHS National Sample Design, Weighting, and Error Estimation. 2023 survey. Accessed 2026-10-27.
- [9] U.S. Consumer Product Safety Commission. Repairing Aluminum Wiring, Publication 516 (June 2011). Publication dated June 2011; cites a Franklin Research Institute survey for CPSC. Accessed 2026-10-27.
- [10] U.S. Consumer Product Safety Commission. CPSC Launches Program to Prevent Home Electrical Wiring System Fires, release 96-129 (May 22, 1996). 1996. Accessed 2026-10-27.
- [11] Weatherization Training Center, Pennsylvania College of Technology. Retrofitting Knob and Tube Wiring: An Investigation into Codes, Assessment, Wiring Practices and Cost (January 2004), funded by the Pennsylvania Department of Community and Economic Development. Field work summer 2002; appendix reproduces a CPSC study of 149 fires (Fire Journal, January/February 1990). Accessed 2026-10-27.
- [12] U.S. Department of Energy (copy hosted by NASCSP). Knob-and-Tube Wiring: Revised Policy Superseding Guidance of 7/25/83 and 7/13/88 (DOE Weatherization Assistance Programs Branch memorandum, October 21, 1988). 1988. Accessed 2026-10-27.
- [14] Iowa Department of Health and Human Services. Iowa Weatherization Assistance Program: Cost Limits and Allowances and Weatherization Measures Expenditure Limits (revised 07/25/2025). Program Year 2025 rules, revised July 25, 2025. Accessed 2026-10-27.
- [15] Minnesota Department of Commerce, Weatherization Assistance Program. Weatherization Innovation through Roofing and Electrification (WIRE) Access Project Policy Manual Addendum (updated July 1, 2025). Effective July 1, 2023; updated July 1, 2025. Accessed 2026-10-27.
- [16] Association of Bay Area Governments (BayREN). A 2026 Knob-and-Tube Rebate Helps Bay Area Homes Move Forward with EASE Home Upgrades (June 15, 2026). 2026. Accessed 2026-10-27.
- [17] City of Boston. Barriers to Installing Insulation ('Knob and tube' electrical wiring; Mass Save and HEAT Loan). Accessed 2026-10-27; page undated. Accessed 2026-10-27.
- [18] City of Menlo Park, Building Division. Knob and Tube Safety Wiring Requirements. Accessed 2026-10-27 (opened with WebFetch; curl blocked). Accessed 2026-10-27.
- [19] Tacoma Power (City of Tacoma). Knob and Tube Wiring Inspection Requirements, Form 3504 (rev. 2/2018). Form revised February 2018. Accessed 2026-10-27.
- [20] Vermont Department for Children and Families, Office of Economic Opportunity. Vermont Weatherization Assistance Program report to the Legislature (January 30, 2026). State fiscal year 2025. Accessed 2026-10-27.
- [25] U.S. Bureau of Labor Statistics. Consumer Price Index for All Urban Consumers (CPI-U), U.S. city average, all items, series CUUR0000SA0 (flat file cu.data.1.AllItems). Annual averages 2002 and 2025. Accessed 2026-10-27.
- [26] U.S. Fire Administration (FEMA). Appliance and Electrical Fire Safety (page last reviewed May 4, 2023). 2023. Accessed 2026-10-27.
- [27] U.S. Census Bureau. ACS 2025 table-based summary file folder (documentation only on 2026-10-27) and 2024 summary file documentation index. Folder listing as of 2026-10-27. Accessed 2026-10-27.
Tier 2: trade bodies, market research, company data (4)
- [13] National Association for State Community Services Programs (NASCSP). WAPTAC Health and Safety Issues: Electrical Issues. Undated resource page. Accessed 2026-10-27.
- [21] Citizens Property Insurance Corporation (Florida). 4-Point Inspection Form, Sample Form Insp4pt 03 25. Form version March 2025. Accessed 2026-10-27.
- [22] Progressive. Does homeowners insurance cover wiring? (updated August 15, 2023). 2023. Accessed 2026-10-27.
- [24] International Association of Electrical Inspectors (IAEI). UL Question Corner: Aluminum Building Wire Installation and Terminations (IAEI Magazine, January/February 2006). 2006. Accessed 2026-10-27.
Tier 3: journalism and expert commentary (1)
- [23] ABC7 San Francisco (KGO-TV). Bay Area homeowners could get coverage denied or canceled for having outdated electrical system (March 13, 2025). 2025. Accessed 2026-10-27.