Solar installer salary by state: BLS pay, jobs and outlook
- Data
- BLS OEWS May 2025, SOC 47-2231 (national, state, metro); BLS Employment Projections 2025-35
- Period
- May 2019 to May 2025 (OEWS); 2025 to 2035 (EP); 2024 (IREC)
- Release used
- 2026-05-15
- Next release
- OEWS May 2026 estimates (annual release, not yet published on 2026-11-05)
- Geography
- United States, 32 states, Puerto Rico, metropolitan and nonmetropolitan areas
- Sources
- 34 (29 official)
The median solar installer salary in the United States was $53,140 a year, or $25.55 an hour, in May 2025, according to BLS OEWS data for SOC 47-2231. New Jersey paid the highest state median, $78,950. Employers reported 31,350 jobs, up from 11,080 in 2019, and BLS projects 36.5% growth from 2025 to 2035.
The median solar installer salary was $53,140 in May 2025
A typical solar PV installer earns slightly more than the median U.S. worker and about $10,050 less than the median electrician. The pay range is narrow for a construction trade.
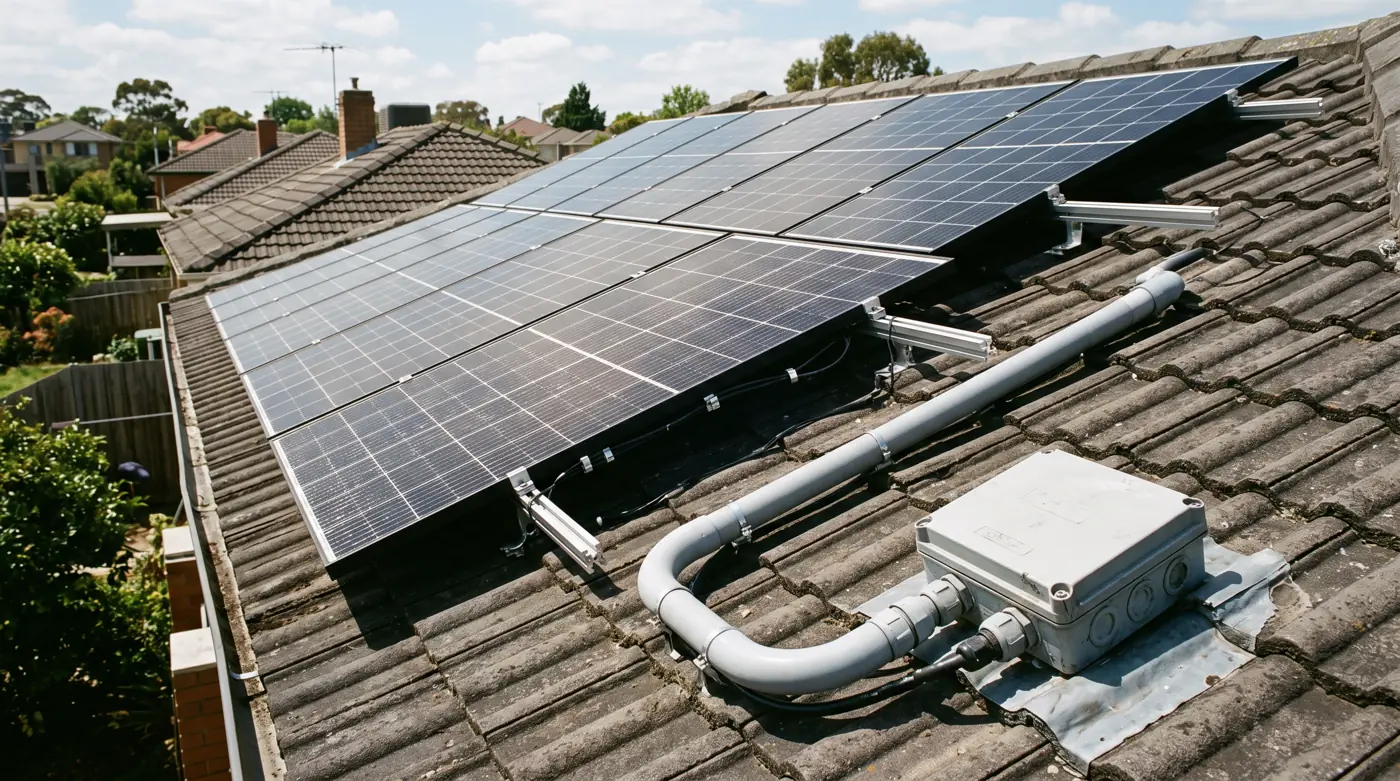
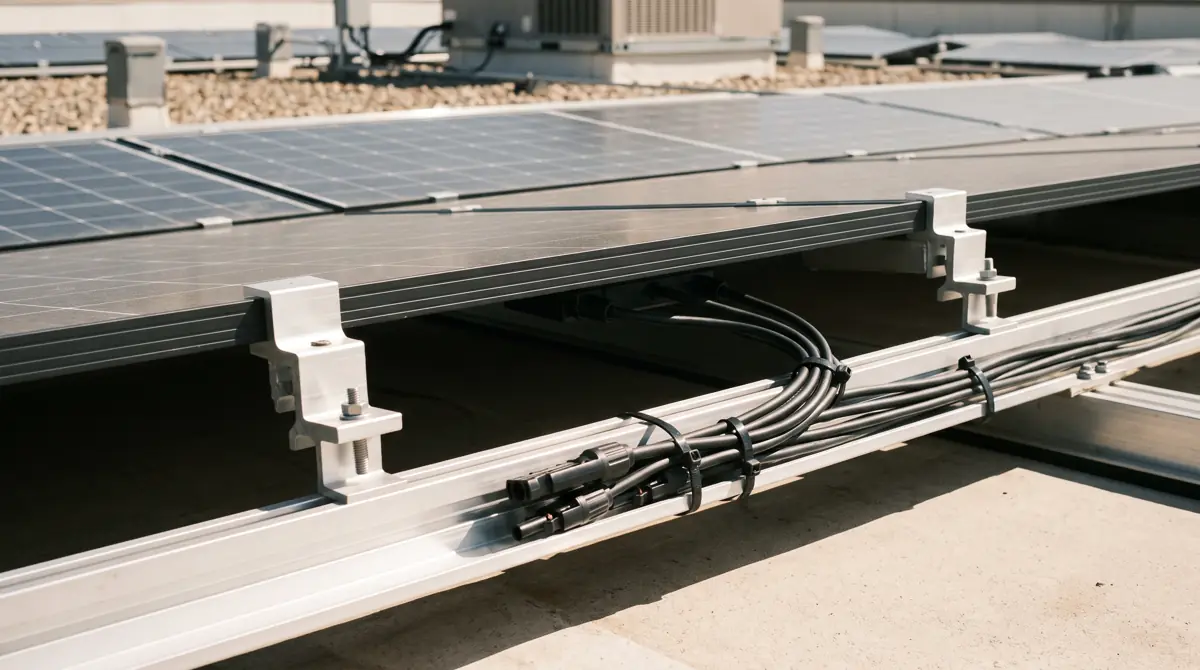
Solar photovoltaic installer (SOC 47-2231): BLS defines the occupation as workers who assemble, install or maintain solar photovoltaic systems on roofs or other structures (O*NET 47-2231.00). Electricians who install PV are counted as electricians (47-2111), not here. OEWS figures cover wage and salary jobs and exclude the self-employed.
The median annual wage for solar photovoltaic installers in the United States was $53,140 in May 2025, or $25.55 an hour (BLS OEWS).
The mean was $57,900 a year ($27.84 an hour). The 25th percentile was $46,700 and the 75th percentile $62,870.
At the edges, the 10th percentile earned $41,600 ($20.00 an hour) and the 90th percentile $79,970 ($38.45 an hour) in May 2025.
| Occupation (SOC) | Employment | Median hourly | Median annual | 10th pct annual | 90th pct annual | Mean annual |
|---|---|---|---|---|---|---|
| Solar Photovoltaic Installers (47-2231) | 31,350 | $25.55 | $53,140 | $41,600 | $79,970 | $57,900 |
| Electricians (47-2111) | 757,220 | $30.38 | $63,190 | $42,640 | $108,510 | $71,490 |
| Roofers (47-2181) | 135,490 | $26.65 | $55,440 | $37,460 | $81,720 | $58,140 |
| Construction and Extraction Occupations (47-0000) | 6,425,160 | $28.63 | $59,540 | $38,100 | $101,650 | $65,360 |
| All Occupations (00-0000) | 155,495,730 | $24.51 | $50,980 | $31,200 | $128,560 | $69,770 |
OEWS wage and salary jobs; excludes the self-employed. Straight-time pay.
Source: [1] U.S. Bureau of Labor Statistics
Solar PV installers earned 84.1% of the median electrician wage of $63,190 and slightly less than roofers ($55,440). The electrician 90th percentile, $108,510, is far above the PV installer 90th percentile, which shows the ceiling difference between the two jobs. For a ranking of all trades, see highest-paying trades; for electrician pay by state, see electrician salary by state.
New Jersey pays solar installers the most: $78,950 a year
BLS published 2025 pay for 32 states. Only 13 have a median above the national $53,140. The state spread is 1.86 to 1, but several small states carry large sampling errors.
Solar photovoltaic installers (SOC 47-2231); grey = not published
Source: U.S. Bureau of Labor Statistics, OEWS May 2025 state file (released 2026-05-15)
New Jersey had the highest median solar PV installer wage in May 2025 at $78,950, or $37.96 an hour, with 1,880 jobs (BLS OEWS state file).
Hawaii ($70,370), Nevada ($67,810), Oregon ($66,320) and Ohio ($62,400) followed. Ohio's median rests on only 70 jobs.
The lowest published medians were South Dakota ($42,380), North Carolina ($43,860) and Arkansas ($44,820). South Dakota's employment estimate has a relative standard error of 49.9%.
Show all 33 rows
| Rank | State | Median annual | Median hourly | Mean annual | Employment | Jobs per 1,000 | Location quotient | Employment RSE % | PV median as % of electrician median |
|---|---|---|---|---|---|---|---|---|---|
| 1 | New Jersey | $78,950 | $37.96 | $78,690 | 1,880 | 0.438 | 2.17 | 16.9 | 102.2% |
| 2 | Hawaii | $70,370 | $33.83 | $73,000 | 420 | 0.663 | 3.29 | 24.1 | 73.0% |
| 3 | Nevada | $67,810 | $32.60 | $70,830 | 100 | 0.066 | 0.33 | 16.6 | 92.2% |
| 4 | Oregon | $66,320 | $31.88 | $71,390 | 360 | 0.183 | 0.91 | 29.1 | 65.5% |
| 5 | Ohio | $62,400 | $30.00 | $59,010 | 70 | 0.012 | 0.06 | 30.1 | 96.4% |
| 6 | Washington | $61,630 | $29.63 | $58,030 | Not published | Not published | Not published | Not published | 64.7% |
| 7 | Maine | $61,210 | $29.43 | $64,350 | 60 | 0.100 | 0.49 | 39.7 | 81.2% |
| 8 | California | $60,600 | $29.14 | $63,280 | 6,830 | 0.375 | 1.86 | 13.6 | 79.6% |
| 9 | Illinois | $59,630 | $28.67 | $62,480 | Not published | Not published | Not published | Not published | 59.9% |
| 10 | Massachusetts | $59,180 | $28.45 | $61,910 | 620 | 0.171 | 0.85 | 35.5 | 74.5% |
| 11 | Iowa | $56,740 | $27.28 | $56,890 | 180 | 0.117 | 0.58 | 20.2 | 93.2% |
| 12 | New York | $56,160 | $27.00 | $56,940 | 1,230 | 0.127 | 0.63 | 35.2 | 71.3% |
| 13 | Connecticut | $55,590 | $26.73 | $55,290 | Not published | Not published | Not published | Not published | 71.7% |
| 14 | Arizona | $51,160 | $24.60 | $54,170 | 1,280 | 0.394 | 1.96 | 24.2 | 83.8% |
| 15 | Florida | $50,550 | $24.30 | $54,780 | 2,980 | 0.300 | 1.49 | 22.2 | 88.3% |
| 16 | South Carolina | $50,490 | $24.27 | $54,980 | Not published | Not published | Not published | Not published | 86.0% |
| 17 | Kansas | $49,990 | $24.04 | $51,210 | Not published | Not published | Not published | Not published | 75.9% |
| 18 | Utah | $49,980 | $24.03 | $54,960 | 770 | 0.442 | 2.19 | 29.9 | 80.6% |
| 19 | Wisconsin | $49,770 | $23.93 | $58,150 | 90 | 0.030 | 0.15 | 32.3 | 65.0% |
| 20 | Colorado | $49,730 | $23.91 | $54,510 | 620 | 0.215 | 1.07 | 29.8 | 79.9% |
| 21 | Vermont | $49,490 | $23.79 | $55,730 | 250 | 0.810 | 4.02 | 39.9 | 78.0% |
| 22 | Virginia | $49,190 | $23.65 | $53,160 | Not published | Not published | Not published | Not published | 78.2% |
| 23 | New Mexico | $48,490 | $23.31 | $53,810 | 340 | 0.389 | 1.93 | 17.8 | 83.0% |
| 24 | Texas | $48,240 | $23.19 | $52,500 | 5,270 | 0.374 | 1.86 | 14.1 | 82.4% |
| 25 | Georgia | $47,790 | $22.98 | $51,030 | Not published | Not published | Not published | Not published | 81.9% |
| 26 | Pennsylvania | $47,760 | $22.96 | $50,680 | 1,210 | 0.199 | 0.99 | 26.0 | 70.7% |
| 27 | Michigan | $47,080 | $22.63 | $50,520 | 310 | 0.071 | 0.35 | 40.3 | 61.7% |
| 28 | Indiana | $46,140 | $22.18 | $49,310 | 490 | 0.154 | 0.76 | 18.6 | 67.4% |
| 29 | Maryland | $45,430 | $21.84 | $51,540 | 670 | 0.241 | 1.20 | 39.9 | 61.8% |
| 30 | Arkansas | $44,820 | $21.55 | $48,710 | Not published | Not published | Not published | Not published | 91.3% |
| 31 | North Carolina | $43,860 | $21.09 | $47,420 | 710 | 0.143 | 0.71 | 30.5 | 77.2% |
| 32 | South Dakota | $42,380 | $20.37 | $53,180 | 50 | 0.104 | 0.51 | 49.9 | 69.0% |
| n/r | Puerto Rico (territory) | $26,860 | $12.91 | $27,040 | 1,890 | 2.016 | 10.00 | 6.9 | 71.7% |
Ranked by median annual wage. 'Not published' = BLS suppressed the employment estimate. Last column compares with the same state's electrician (47-2111) median.
Source: [2] U.S. Bureau of Labor Statistics
Per job, Vermont has the densest solar installer workforce: 0.81 installers per 1,000 jobs, followed by Hawaii (0.663) and Utah (0.442). California's 6,830 installers equal 0.375 per 1,000 jobs.
Compared with electricians in the same state, solar PV installer pay ranges from 59.9% of the electrician median in Illinois to 102.2% in New Jersey, the only state where installers out-earn the median electrician.
Hawaii and the Bay Area have the top-paying metros, up to $78,420
Eleven of the 12 highest area medians are in Hawaii, California, Nevada, the Portland metro and the New York metro; the exception is eastern and southern Colorado. The largest job centers pay much less than the top-paying ones.
Median annual wage
Source: U.S. Bureau of Labor Statistics, OEWS May 2025 metropolitan and nonmetropolitan area file
The Hawaii / Kauai nonmetropolitan area had the highest median at $78,420 in May 2025, just ahead of Kahului-Wailuku, HI ($78,360). Each has 40 jobs (BLS OEWS area file).
Among metros with several hundred jobs, San Francisco-Oakland-Fremont ($72,150, 710 jobs) and New York-Newark-Jersey City ($70,130, 2,190 jobs) paid the most.
| Rank | Area | Type | Median annual | Median hourly | Employment |
|---|---|---|---|---|---|
| 1 | Hawaii / Kauai nonmetropolitan area | Nonmetro | $78,420 | $37.70 | 40 |
| 2 | Kahului-Wailuku, HI | Metro | $78,360 | $37.67 | 40 |
| 3 | San Francisco-Oakland-Fremont, CA | Metro | $72,150 | $34.69 | 710 |
| 4 | San Jose-Sunnyvale-Santa Clara, CA | Metro | $71,630 | $34.44 | 280 |
| 5 | New York-Newark-Jersey City, NY-NJ | Metro | $70,130 | $33.72 | 2,190 |
| 6 | Urban Honolulu, HI | Metro | $69,940 | $33.63 | 330 |
| 7 | Santa Cruz-Watsonville, CA | Metro | $69,550 | $33.44 | 40 |
| 8 | Las Vegas-Henderson-North Las Vegas, NV | Metro | $67,810 | $32.60 | 60 |
| 9 | Portland-Vancouver-Hillsboro, OR-WA | Metro | $66,320 | $31.88 | 210 |
| 10 | Eastern and Southern Colorado nonmetropolitan area | Nonmetro | $64,540 | $31.03 | 30 |
| 11 | Salinas, CA | Metro | $62,260 | $29.93 | Not published |
| 12 | Santa Rosa-Petaluma, CA | Metro | $61,810 | $29.72 | 100 |
Includes metropolitan and nonmetropolitan areas with a published median. Many areas have fewer than 100 jobs.
Source: [3] U.S. Bureau of Labor Statistics
The metros with the most installers were New York-Newark-Jersey City (2,190), Los Angeles-Long Beach-Anaheim (1,930 at $59,600), San Juan-Bayamon-Caguas, PR (1,700 at $26,860), Houston (1,620 at $47,060) and Dallas-Fort Worth (1,570 at $48,350).
Electrical contractors employ 39% of solar PV installers and pay $58,570
Where an installer works matters about as much as where they live. Contractor jobs pay more than temporary help and utility jobs.
Median annual wage by industry, May 2025
Source: U.S. Bureau of Labor Statistics, Occupational Outlook Handbook (OEWS May 2025 wages)
Electrical contractors and other wiring installation contractors (NAICS 238210) employed 39% of solar PV installers in 2025 and paid a median $58,570 in May 2025 (BLS Occupational Outlook Handbook).
Plumbing, heating and air-conditioning contractors (238220) employed 11% at $57,260. Utilities employed 13% at $51,460; power and communication line construction 10% at $48,460.
Temporary help services employed 17% of installers, the second largest share, at the lowest median of the five, $47,100.
| Industry | NAICS | Share of PV installer jobs, 2025 | Median annual wage, May 2025 |
|---|---|---|---|
| Electrical contractors and other wiring installation contractors | 238210 | 39% | $58,570 |
| Temporary help services | 561320 | 17% | $47,100 |
| Utilities | 221 | 13% | $51,460 |
| Plumbing, heating, and air-conditioning contractors | 238220 | 11% | $57,260 |
| Power and communication line and related structures construction | 237130 | 10% | $48,460 |
Shares are 2025 Employment Projections matrix shares; wages are OEWS May 2025 medians, as published in the OOH. NAICS codes added by ECW.
Source: [11] U.S. Bureau of Labor Statistics
BLS counted 31,350 solar installer jobs in 2025, up from 11,080 in 2019
Wage and salary employment nearly tripled in six survey years. Growth was uneven, and the industry-wide IREC count grew far more slowly, which says more about who gets coded as an installer than about the market.
OEWS employment, wage and salary jobs
Source: U.S. Bureau of Labor Statistics, OEWS national files, May 2019 to May 2025
OEWS employment of solar PV installers rose from 11,080 in May 2019 to 31,350 in May 2025, an increase of 182.9% or 18.9% a year (BLS OEWS).
The largest one-year rise was 2021 to 2022 (+11,340 jobs, 69.1%). Employment then fell 3,250 jobs (-11.7%) to 24,510 in May 2023 before recovering.
Annual wages, nominal dollars
Source: U.S. Bureau of Labor Statistics, OEWS national files, May 2019 to May 2025
The nominal median rose 18.4% over the same period, from $44,890 to $53,140. These figures are not adjusted for inflation.
| Year (May) | Employment | Employment RSE % | 10th pct annual | Median annual | 90th pct annual | Median hourly |
|---|---|---|---|---|---|---|
| 2019 | 11,080 | 9.1 | $31,600 | $44,890 | $63,880 | $21.58 |
| 2020 | 11,490 | 9.2 | $32,590 | $46,470 | $64,600 | $22.34 |
| 2021 | 16,420 | 8.7 | $36,320 | $47,670 | $72,080 | $22.92 |
| 2022 | 27,760 | 5.4 | $35,520 | $45,230 | $63,330 | $21.75 |
| 2023 | 24,510 | 4.8 | $37,920 | $48,800 | $73,560 | $23.46 |
| 2024 | 28,280 | 5.2 | $39,070 | $51,860 | $80,150 | $24.93 |
| 2025 | 31,350 | 6.1 | $41,600 | $53,140 | $79,970 | $25.55 |
OEWS national estimates by survey year. RSE = relative standard error of the employment estimate.
Source: [1][4][5][6][7][8][9] U.S. Bureau of Labor Statistics; U.S. Bureau of Labor Statistics; U.S. Bureau of Labor Statistics; U.S. Bureau of Labor Statistics; U.S. Bureau of Labor Statistics; U.S. Bureau of Labor Statistics; U.S. Bureau of Labor Statistics
IREC's employer survey counted 280,119 solar workers of all kinds in 2024, 672 more than in 2023, with growth in 33 states (IREC National Solar Jobs Census 2024). California led with 78,982 solar jobs but lost about 1,000 after its net metering change (IREC Solar Jobs by State). For state net metering rules, see net metering by state.
| State | IREC solar jobs, 2024 | IREC installation and project development jobs, 2024 | OEWS PV installer jobs, May 2025 | IREC installation jobs per OEWS PV installer | OEWS PV installer median, May 2025 |
|---|---|---|---|---|---|
| California | 78,982 | 49,493 | 6,830 | 7.2 | $60,600 |
| Texas | 12,820 | 5,991 | 5,270 | 1.1 | $48,240 |
| Florida | 14,303 | 9,146 | 2,980 | 3.1 | $50,550 |
| New York | 11,923 | 7,842 | 1,230 | 6.4 | $56,160 |
| Pennsylvania | 4,229 | 2,103 | 1,210 | 1.7 | $47,760 |
| Illinois | 5,905 | 3,806 | Not published | Not computable | $59,630 |
| Ohio | 8,179 | 4,869 | 70 | 69.6 | $62,400 |
| Georgia | 5,894 | 3,378 | Not published | Not computable | $47,790 |
| North Carolina | 7,500 | 4,504 | 710 | 6.3 | $43,860 |
| Michigan | 4,385 | 2,774 | 310 | 8.9 | $47,080 |
IREC counts all solar firms' staff in installation and project development (2024); OEWS counts one occupation (May 2025).
Source: [18][2] Interstate Renewable Energy Council (IREC); U.S. Bureau of Labor Statistics
In the 10 largest states, IREC counts between 1.1 and 69.6 installation and project development jobs for every OEWS solar PV installer. The low end is Texas; the high end is Ohio, where OEWS finds only 70 installers. The gap suggests that much of the solar installation workforce is classified under other occupations, such as electricians, or works in sales and design, rather than as 47-2231 installers.
Solar installer job outlook: 36.5% projected growth, with the 25D credit gone
BLS projects the second fastest growth of any occupation, but from a small base. The projections came out after the residential credit was cut, and no official count yet shows what 2026 did to installer jobs.
Projected employment change, percent
Source: U.S. Bureau of Labor Statistics, Employment Projections 2025-35 (released 2026-08-27)
BLS projects employment of solar photovoltaic installers to grow 36.5% from 31,100 in 2025 to 42,400 in 2035, an increase of 11,300 jobs (BLS Employment Projections). Only nurse practitioners (41.0%) are projected to grow faster.
About 4,200 openings a year are projected. Of these, about 3,100 replace workers who transfer to other occupations (2,400) or leave the labor force (600), so 73.8% of openings are replacements. Openings equal 13.5% of 2025 employment each year.
In the release text, BLS links the growth to rising electricity demand and notes that solar PV installers and wind turbine service technicians together are projected to add fewer than 15,000 jobs by 2035 (BLS EP release, August 27, 2026).
| Occupation (SOC) | Employment 2025 | Projected 2035 | Change | Change % | Openings per year |
|---|---|---|---|---|---|
| Solar photovoltaic installers (47-2231) | 31,100 | 42,400 | 11,300 | 36.5% | 4,200 |
| Electricians (47-2111) | 821,000 | 896,900 | 75,900 | 9.2% | 72,700 |
| Construction trades workers (47-2000) | 5,678,100 | 6,002,100 | 323,900 | 5.7% | 443,200 |
| Total, all occupations (00-0000) | 170,280,800 | 176,198,500 | 5,917,600 | 3.5% | 17,461,800 |
BLS Employment Projections base employment includes the self-employed, so it differs from OEWS.
Source: [13] U.S. Bureau of Labor Statistics
No official or Tier 2 series yet measures installer employment after the credit ended. OEWS May 2025 predates it, the next OEWS release (May 2026 estimates) has not been published as of 2026-11-05, and IREC's 16th census edition was still described as upcoming in a September 2026 prospectus. The 25D credit applied to property for a taxpayer's home; utilities (13% of installer jobs) and power and communication line construction (10%) are among the largest employers, and their work is not residential. For installed system prices, see {a('/data/average-cost-of-solar-panels/', 'average cost of solar panels')}.
Do solar installers need to be electricians? 4 of the 10 largest states say yes
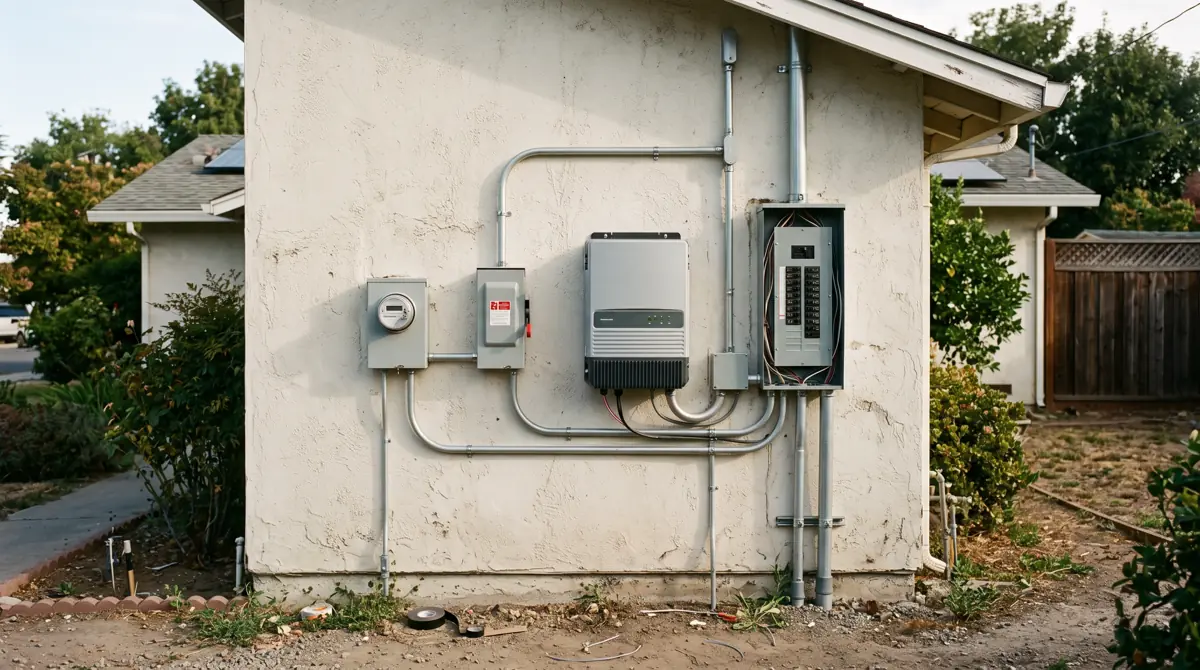
State rules split four ways: electrical license, solar specialty license, installer certification, or local licensing only. The PV installer job title itself is rarely licensed; the electrical connection usually is.
In Texas, TDLR regulates solar installation by electricians and electrical contractors under the Texas Electrical Safety and Licensing Act. Since September 1, 2025, residential solar contracts must provide that a licensed electrical contractor will perform the installation and must name that contractor (TDLR).
Georgia's Attorney General says installing solar panels on a home can be electrical contracting and the installer must be associated with a licensed electrical contractor (Georgia Consumer Protection Division). North Carolina's statute requires a board license to install any electric work, wiring, devices or equipment, and the board lists 10 license classes with no PV-only class (NCBEEC).
California and Florida offer a solar specialty route. California's C-46 Solar class covers thermal and photovoltaic systems, alongside the C-10 Electrical class (CSLB). Florida's statute defines a solar contractor to include photovoltaic systems.
Illinois requires Illinois Commerce Commission certification for every entity installing distributed generation after December 31, 2013, except self-installers (83 Ill. Adm. Code 468.30). New York has no statewide solar license and leaves licensing to local authorities, and Pennsylvania has no state licensure for most construction contractors.
| Pop. rank | State | Population, July 2025 | State-level rule for PV installation | Electrical license required statewide? | Agency source | Evidence |
|---|---|---|---|---|---|---|
| 1 | California | 39,355,309 | C-10 Electrical or C-46 Solar contractor license; C-46 covers thermal and photovoltaic systems | No: a C-46 solar specialty license is an alternative to C-10 | CSLB C-46 classification; CSLB ESS report | Agency rule text |
| 2 | Texas | 31,709,821 | TDLR regulates PV installation by electricians and electrical contractors; since September 1, 2025 residential solar contracts must provide that a licensed electrical contractor performs the installation; retailers must register from September 1, 2026 | Yes | TDLR solar consumer sheet; TDLR news release | Agency statement |
| 3 | Florida | 23,462,518 | Certified or registered solar contractor (Chapter 489, Part I) covers photovoltaic systems; other licensed contractors may work within their own scope | No: a solar contractor license is an alternative | Fla. Stat. 489.105(3)(o) | Statute text |
| 4 | New York | 20,002,427 | No statewide solar license; some local authorities require an electrical or home improvement license; New York City accepts no reciprocity | No: set locally | NYSERDA, Doing Solar Business in New York | Agency statement |
| 5 | Pennsylvania | 13,059,432 | No state licensure for most construction contractors; some of the 2,562 municipalities license electricians | No: set locally | PA Department of Labor and Industry | Agency statement |
| 6 | Illinois | 12,719,141 | Entities installing distributed generation must hold Illinois Commerce Commission installer certification (self-installers exempt) | No: state installer certification instead | 83 Ill. Adm. Code 468.30 | Rule text |
| 7 | Ohio | 11,900,510 | OCILB issues state licenses to electrical contractors who perform commercial work | Commercial work only; residential rule not confirmed on an agency page | OCILB testing application | Agency form |
| 8 | Georgia | 11,302,748 | Installation can be electrical contracting; the installer must be associated with a licensed electrical contractor | Yes | Georgia Attorney General, Consumer Protection Division | Agency statement |
| 9 | North Carolina | 11,197,968 | Statute requires a board license to install any electric work, wiring, devices or equipment; the board lists 10 classes and none is PV-specific | Yes (ECW reading of statute) | N.C.G.S. 87-43; NCBEEC licensing page | Statute text plus ECW reading |
| 10 | Michigan | 10,127,884 | LARA exempts only qualifying large-scale utility PV projects installed independent of any other structure from electrical licensing (MCL 339.5737(3)(d)) | Yes for systems on structures (ECW reading of exemption scope) | LARA large-scale PV projects page | Agency statement plus ECW reading |
Population rank from Census Vintage 2025. Rules summarised from agency pages opened 2026-11-05; local permits and licences apply on top. Not legal advice.
Source: [20][21][23][25][26][27][28][29][30][31][33] U.S. Census Bureau; California Contractors State License Board; Texas Department of Licensing and Regulation; Florida Legislature; NYSERDA; Pennsylvania Department of Labor and Industry; Illinois General Assembly, JCAR; Ohio Construction Industry Licensing Board; Georgia Attorney General, Consumer Protection Division; North Carolina General Assembly; Michigan Department of Licensing and Regulatory Affairs
IREC's national solar licensing database was last updated in December 2022, so this sample relies on agency pages opened in November 2026. For each state's electrical board, license levels and reciprocity, see the electrical license lookup. This is a summary, not legal advice; local permits apply on top.
How we ranked the states
Growth in OEWS solar PV installer employment, May 2019 to May 2025
Formula(emp2025 / emp2019 - 1) x 100
Inputs: rows 1, 31 (fact sheet rows)
Result: 182.9% (+20,270 jobs)
The occupation grew much faster than construction employment, though part of the rise is reclassification and sampling.
Limitations: OEWS is not built for time series; RSE 9.1% in 2019.
Compound annual growth in OEWS employment, 2019 to 2025
Formula(emp2025 / emp2019)^(1/6) - 1
Inputs: rows 1, 31 (fact sheet rows)
Result: 18.9%
A steady annual rate for comparison with other trades.
Limitations: Six survey years; smooths a 2023 dip.
Change in nominal median annual wage, 2019 to 2025
Formula(median2025 / median2019 - 1) x 100
Inputs: rows 2, 32 (fact sheet rows)
Result: 18.4% (+$8,250)
Pay rose more slowly than headcount.
Limitations: Not adjusted for inflation.
PV installer median as a share of the electrician median, U.S.
FormulaPV median / electrician median x 100
Inputs: rows 44, 45 (fact sheet rows)
Result: 84.1% (gap $10,050)
Installers earn less than electricians at the median and far less at the top.
Limitations: Different skill and licence requirements.
Highest vs lowest published state median
FormulaNJ median / SD median
Inputs: rows 66, 74 (fact sheet rows)
Result: 1.86x (gap $36,570)
Location changes pay more than any single other factor in the data.
Limitations: South Dakota employment RSE is 49.9%; only 32 states published.
States with a median above the national median
Formulacount of published states with median > 53,140
Inputs: row 32 and t2 state rows (fact sheet rows)
Result: 13 of 32
Most published states pay below the national median because large high-wage states pull it up.
Limitations: Suppressed states excluded.
Share of U.S. PV installer jobs in California, Texas and Florida
Formula(CA + TX + FL emp) / US emp x 100
Inputs: rows 51, 75, 54, 31 (fact sheet rows)
Result: 48.1% (15,080 jobs)
Three states hold close to half of all jobs.
Limitations: State estimates carry RSEs of 13.6% to 22.2%.
States where the PV installer median is at or above the electrician median
Formulacount of states with PV median / electrician median >= 100%
Inputs: t2 state rows (fact sheet rows)
Result: 1 of 32 (New Jersey 102.2%); lowest Illinois 59.9%
Only New Jersey pays PV installers more than electricians.
Limitations: Electrician medians include all industries.
Replacement share of projected annual openings, 2025 to 2035
Formulaseparations / openings x 100
Inputs: row 147 (fact sheet rows)
Result: 73.8% (openings equal 13.5% of 2025 jobs a year)
Most openings come from turnover, not growth.
Limitations: Rounded EP inputs (3.1k, 4.2k, 31.1k).
IREC installation and project development jobs per OEWS PV installer, 10 largest states
FormulaIREC IPD jobs 2024 / OEWS PV installer jobs May 2025
Inputs: t8 rows (IREC dataset rows, OEWS state rows) (fact sheet rows)
Result: California 7.2; Texas 1.1; Florida 3.1; New York 6.4; Pennsylvania 1.7; Ohio 69.6; North Carolina 6.3; Michigan 8.9
OEWS captures a narrow slice of the solar installation workforce.
Limitations: Different years, scopes and survey designs; IL and GA OEWS employment not published.
Ten largest states requiring an electrical license for PV installation statewide
Formulacount of t7 rows marked Yes
Inputs: t7 (fact sheet rows)
Result: 4 of 10 (Texas, Georgia, North Carolina, Michigan); local only 2
An electrical license is the most common statewide route among large states, but not a majority.
Limitations: Two of the four rest on ECW reading of statute or exemption scope.
Largest one-year rise and fall in OEWS employment
Formulaemp(t) - emp(t-1)
Inputs: rows 11, 16, 21 (fact sheet rows)
Result: 2021 to 2022 +11,340 (69.1%); 2022 to 2023 -3,250 (-11.7%)
Employment is volatile from year to year.
Limitations: Year-to-year OEWS moves include sampling error.
State by state
- The U.S. median annual wage for solar photovoltaic installers was $53,140 in May 2025, against $50,980 for all occupations.[1]
- The 10th percentile solar PV installer earned $41,600 and the 90th percentile $79,970 in May 2025 (U.S.).[1]
- The median solar PV installer earned 84.1% of the median electrician wage ($63,190) in May 2025, a gap of $10,050.[1]
- New Jersey had the highest state median, $78,950, in May 2025; South Dakota the lowest, $42,380, a ratio of 1.86.[2]
- New Jersey is the only one of 32 published states where the PV installer median ($78,950) exceeds the state electrician median, at 102.2% of it (May 2025).[2]
- Vermont had the highest concentration: 0.81 solar PV installer jobs per 1,000 jobs, a location quotient of 4.02 (May 2025).[2]
- California employed 6,830 solar PV installers in May 2025, the most of any state, at a median $60,600.[2]
- The highest-paying area was the Hawaii / Kauai nonmetropolitan area at $78,420; the highest-paying large metro was San Francisco-Oakland-Fremont at $72,150 with 710 jobs (May 2025).[3]
- Puerto Rico employed 1,890 solar PV installers in May 2025 at a median $26,860, a location quotient of 10.[2]
- Electrical contractors employed 39% of solar PV installers in 2025 and paid a median $58,570; temporary help services employed 17% at $47,100.[11]
- OEWS solar PV installer employment grew 182.9% from May 2019 to May 2025, a compound 18.9% a year.[1][9]
- The nominal U.S. median wage rose 18.4% from $44,890 (May 2019) to $53,140 (May 2025), before inflation.[1][9]
- BLS projects solar PV installer employment to grow 36.5% from 31,100 in 2025 to 42,400 in 2035, the second fastest rate after nurse practitioners.[13][12]
- IREC counted 280,119 U.S. solar workers in 2024, 672 more than in 2023, across all solar occupations.[16]
- In California, IREC counted 49,493 installation and project development jobs in 2024, 7.2 for every solar PV installer in the OEWS count.[18][2]
In short
- Solar photovoltaic installers earned a median $53,140 a year ($25.55 an hour) in May 2025; the middle half earned between $46,700 and $62,870 (BLS OEWS).
- BLS published pay for 32 states. New Jersey led at $78,950, followed by Hawaii ($70,370) and Nevada ($67,810); South Dakota was lowest at $42,380 (BLS OEWS state file).
- California (6,830), Texas (5,270) and Florida (2,980) held 48.1% of the 31,350 U.S. jobs in May 2025.
- OEWS employment rose 182.9% from 11,080 in May 2019 to 31,350 in May 2025, with a dip in 2023.
- Installers working for electrical contractors (NAICS 238210) earned a median $58,570, the highest of the five largest employing industries (BLS Occupational Outlook Handbook).
- BLS projects 36.5% growth from 2025 to 2035 and about 4,200 openings a year; 73.8% of those openings replace workers who leave (BLS Employment Projections).
- The 30% federal Residential Clean Energy Credit (25D) is not available for property placed in service after December 31, 2025 (IRS); no official jobs series yet covers 2026.
- Of the 10 largest states, 4 require installation under an electrical license statewide, 2 accept a solar specialty contractor license, Illinois requires a state installer certification, Ohio licenses electrical contractors for commercial work, and New York and Pennsylvania leave licensing to local governments.
What people search for
How much do solar panel installers make an hour?
The median hourly wage for solar photovoltaic installers was $25.55 in May 2025 (U.S., BLS OEWS). The 10th percentile earned $20.00 and the 90th percentile $38.45. New Jersey had the highest state median at $37.96 an hour.
Is solar installer a good career?
On BLS numbers, demand is strong and pay is moderate. Employment is projected to grow 36.5% from 2025 to 2035 with about 4,200 openings a year, while the May 2025 median of $53,140 is 84.1% of the electrician median. The end of the 25D residential credit after 2025 adds near-term uncertainty that no official data yet measures.
Do solar installers need to be electricians?
It depends on the state. Among the 10 largest states, 4 (Texas, Georgia, North Carolina, Michigan) require installation under an electrical license statewide, California and Florida also accept a solar specialty license, Illinois requires state installer certification, Ohio licenses commercial electrical contractors, and New York and Pennsylvania leave it to local governments.
Which state pays solar installers the most?
New Jersey, with a median of $78,950 a year in May 2025 (BLS OEWS). Hawaii ($70,370) and Nevada ($67,810) were next. Among areas, the Hawaii / Kauai nonmetropolitan area paid the most at $78,420.
Common questions
What is the average solar installer salary?
The mean annual wage for solar photovoltaic installers was $57,900 in May 2025 and the median $53,140 (U.S., BLS OEWS). The mean is higher because a minority of high earners pull it up.
How many solar installers are there in the U.S.?
OEWS counted 31,350 wage and salary solar PV installer jobs in May 2025. BLS Employment Projections, which include the self-employed, put 2025 employment at 31,100. IREC counted 280,119 solar workers of all occupations in 2024.
What do the lowest-paid solar installers earn?
The 10th percentile annual wage was $41,600 ($20.00 an hour) in May 2025 (U.S.). The lowest published state median was South Dakota at $42,380.
How much do solar installers make in California?
The California median was $60,600 a year ($29.14 an hour) in May 2025, with 6,830 jobs, the most of any state (BLS OEWS). San Francisco-Oakland-Fremont paid $72,150.
How much do solar installers make in Texas?
The Texas median was $48,240 a year ($23.19 an hour) in May 2025, with 5,270 jobs (BLS OEWS). Texas requires a TDLR-licensed electrical contractor for installation.
How much do solar installers make in Florida?
The Florida median was $50,550 a year ($24.30 an hour) in May 2025, with 2,980 jobs (BLS OEWS).
Do solar installers make more than electricians?
Not at the national level. The May 2025 U.S. median was $53,140 for solar PV installers and $63,190 for electricians. New Jersey is the one published state where the installer median ($78,950) exceeds the electrician median.
Which industry pays solar installers best?
Of the five largest employing industries, electrical contractors paid the highest median, $58,570, in May 2025, followed by plumbing and HVAC contractors at $57,260 (BLS OOH).
How fast are solar installer jobs growing?
OEWS employment grew 182.9% from May 2019 to May 2025. BLS projects 36.5% growth from 2025 to 2035, the second fastest of all occupations.
Did the end of the solar tax credit cut installer jobs?
No official series answers that yet. The IRS says the 25D credit is not available for property placed in service after December 31, 2025; OEWS May 2026 estimates and IREC's next census had not been released as of 2026-11-05.
Get the data
Every table in this report is available as a CSV under CC BY 4.0. The fact sheet lists each value with its source URL and access date.
- derived_metrics.csv (CSV)
- fact_sheet.csv (CSV)
- Solar PV installer pay vs electricians, roofers and all jobs, May 2025 (CSV)
- Solar installer salary by state, May 2025 (32 published states plus Puerto Rico) (CSV)
- Top-paying areas for solar PV installers, May 2025 (CSV)
- Solar PV installer pay in the five largest employing industries (CSV)
- Solar PV installer employment and pay, May 2019 to May 2025 (CSV)
- Projected employment and openings, 2025 to 2035 (CSV)
- Do solar installers need an electrical license? The 10 largest states (CSV)
- Industry solar jobs vs BLS installer jobs, 10 largest states (CSV)
Cite this report
The figures to cite first
- The median solar installer salary in the United States was $53,140 a year ($25.55 an hour) in May 2025, according to BLS OEWS data for SOC 47-2231.[1]
- New Jersey paid solar photovoltaic installers the highest state median wage in May 2025, $78,950 a year, per BLS OEWS.[2]
- BLS projects solar photovoltaic installer employment to grow 36.5% from 2025 to 2035, the second fastest rate of any U.S. occupation.[13]
Quotable figures
- The median solar installer salary in the United States was $53,140 a year ($25.55 an hour) in May 2025, according to BLS OEWS data for SOC 47-2231.[1]
- New Jersey paid solar photovoltaic installers the highest state median wage in May 2025, $78,950 a year, per BLS OEWS.[2]
- BLS OEWS counted 31,350 solar photovoltaic installer jobs in May 2025, 182.9% more than the 11,080 counted in May 2019.[1][9]
- BLS projects solar photovoltaic installer employment to grow 36.5% from 2025 to 2035, the second fastest rate of any U.S. occupation.[13]
- In May 2025 the U.S. median solar PV installer earned 84.1% of the median electrician wage ($53,140 vs $63,190), per BLS OEWS.[1]
- Electrical contractors employed 39% of U.S. solar photovoltaic installers in 2025 and paid them a median $58,570 in May 2025, per the BLS Occupational Outlook Handbook.[11]
- Of the 10 most populous U.S. states, 4 require solar PV installation under an electrical license statewide, based on agency pages reviewed in November 2026.[23][30][31][33]
Summary for editors
Solar photovoltaic installers in the United States earned a median $53,140 a year in May 2025, or $25.55 an hour, according to an Electrical Contractors and Wiring analysis of Bureau of Labor Statistics OEWS data. New Jersey paid the most of the 32 states with published data, at $78,950, and South Dakota the least, at $42,380. BLS counted 31,350 installer jobs, up 182.9% from 2019, with California, Texas and Florida holding 48.1% of them. The median installer earned 84.1% of the median electrician wage. Electrical contractors employed 39% of installers and paid the highest industry median, $58,570. BLS projects 36.5% employment growth from 2025 to 2035, second only to nurse practitioners, but the federal 25D residential solar credit ended for property placed in service after December 31, 2025, and no official data yet show the effect on jobs. A review of agency rules found that 4 of the 10 largest states require PV installation under an electrical license statewide.
Headlines the data supports
- Solar installer salary: BLS puts the U.S. median at $53,140
- New Jersey pays solar installers $78,950, the most of any state
- Solar installer jobs up 182.9% since 2019, BLS data show
- BLS: solar PV installer is the second fastest growing job through 2035
- Do solar installers need to be electricians? In 4 of 10 big states, yes
Citation
Electrical Contractors and Wiring. (2026). Solar installer salary by state: BLS pay, jobs and outlook. Retrieved from https://electricalcontractorsandwiring.com/data/solar-installer-salary/
Reuse
Data and tables are licensed CC BY 4.0. Attribution: “Source: Electrical Contractors and Wiring, Solar installer salary by state: BLS pay, jobs and outlook” with a link to this page.
How we built this report
Selection: wage and employment figures come from the BLS Occupational Employment and Wage Statistics (OEWS) program, May 2025 (released 2026-05-15), for SOC 47-2231 at national, state, metropolitan and nonmetropolitan level, plus May 2019 to May 2024 national files for the trend. Projections come from BLS Employment Projections 2025-35 (released 2026-08-27). Industry shares and medians come from the BLS Occupational Outlook Handbook. IREC's National Solar Jobs Census 2024 is used as a Tier 2 industry-wide count. Licensing rules come from state agency pages, statutes and rules only.
Access: bls.gov returned HTTP 403 to a browser user agent, so every BLS file and page was read from an Internet Archive snapshot taken between September and October 2026, and the snapshot URL is cited. The OEWS zips were unpacked and the 47-2231 rows extracted (raw/oews/extract_*.csv); the 40 MB area zip and 7.5 MB state zip were deleted after extraction to save disk, and the extract scripts are in scripts/.
Inclusion: all 32 states and Puerto Rico with a published 47-2231 median are shown; BLS suppressed the other states. Employment cells BLS did not publish are marked 'Not published'. Areas are ranked by median annual wage; ties in rounding are kept in BLS order.
Conflicts: OEWS (31,350 jobs, wage and salary only) and Employment Projections (31,100, including self-employed) give different 2025 counts; both are shown and labelled. IREC counts all solar industry workers, so its figures are not compared one to one with OEWS; the ratio in table t8 is labelled as a scope gap, not a measurement of the same workers. The IRS 25D page states both an end date of December 31, 2025 and an older phase-out year of 2033; the explicit end date is used.
Derived metrics: each of the 12 derived metrics in derived_metrics.csv lists its formula and fact sheet rows. Wages are nominal. The licensing count rests on ECW's reading of North Carolina's statute and Michigan's exemption scope; both are marked in table t7.
Limitations: OEWS is a survey with relative standard errors from 6.1% (national employment) to 49.9% (South Dakota); it excludes the self-employed and overtime. OEWS is not designed for year-to-year comparison. Most solar crew members are coded as electricians, roofers or laborers, so 47-2231 understates the solar installation workforce. No official data cover 2026.
Neutrality: no installer, employer, union or training provider is promoted. Nothing here is legal, tax or career advice. Last updated 2026-11-05.
This report presents published data with its limitations. It is not legal, financial or investment advice.
Sources by tier
Tier 1: primary and official sources (29)
- [1] U.S. Bureau of Labor Statistics. OEWS May 2025 national file, archived copy (47-2231 and comparators). May 2025 (released 2026-05-15). Accessed 2026-11-03.
- [2] U.S. Bureau of Labor Statistics. OEWS May 2025 state file, archived copy (47-2231, 47-2111). May 2025 (released 2026-05-15). Accessed 2026-11-05.
- [3] U.S. Bureau of Labor Statistics. OEWS May 2025 metropolitan and nonmetropolitan area files, archived copy. May 2025 (released 2026-05-15). Accessed 2026-11-05.
- [4] U.S. Bureau of Labor Statistics. OEWS May 2024 national file, archived copy. May 2024. Accessed 2026-11-05.
- [5] U.S. Bureau of Labor Statistics. OEWS May 2023 national file, archived copy. May 2023. Accessed 2026-11-05.
- [6] U.S. Bureau of Labor Statistics. OEWS May 2022 national file, archived copy. May 2022. Accessed 2026-11-05.
- [7] U.S. Bureau of Labor Statistics. OEWS May 2021 national file, archived copy. May 2021. Accessed 2026-11-05.
- [8] U.S. Bureau of Labor Statistics. OEWS May 2020 national file, archived copy. May 2020. Accessed 2026-11-05.
- [9] U.S. Bureau of Labor Statistics. OEWS May 2019 national file, archived copy. May 2019. Accessed 2026-11-05.
- [10] U.S. Bureau of Labor Statistics. Occupational Employment and Wages, May 2025 (USDL-26-0725), archived copy. May 2025; released 2026-05-15. Accessed 2026-11-03.
- [11] U.S. Bureau of Labor Statistics. Occupational Outlook Handbook: Solar Photovoltaic Installers, archived copy. May 2025 wages; 2025-35 outlook. Accessed 2026-11-03.
- [12] U.S. Bureau of Labor Statistics. Employment Projections: 2025-2035 Summary (USDL-26-1422), archived copy. 2025 to 2035; released 2026-08-27. Accessed 2026-11-03.
- [13] U.S. Bureau of Labor Statistics. Employment Projections occupation tables (occupation.xlsx), archived copy. 2025 to 2035. Accessed 2026-11-03.
- [14] U.S. Department of Labor, O*NET. O*NET OnLine 47-2231.00 Solar Photovoltaic Installers. Updated 2026. Accessed 2026-11-03.
- [15] Internal Revenue Service. Residential Clean Energy Credit. Page reviewed 2026-07-04. Accessed 2026-11-03.
- [20] U.S. Census Bureau. State population totals, Vintage 2025 (NST-EST2025-ALLDATA). July 1, 2025. Accessed 2026-11-05.
- [21] California Contractors State License Board. C-46 Solar Contractor classification. Current regulation (16 CCR 832.46). Accessed 2026-11-05.
- [22] California Contractors State License Board. Energy Storage Systems report (Board packet). Board report, 2019 data. Accessed 2026-11-05.
- [23] Texas Department of Licensing and Regulation. Solar Panel Consumer Information (2025). 2025. Accessed 2026-11-05.
- [24] Texas Department of Licensing and Regulation. Residential Solar Retail Sales Now Regulated By TDLR. 2025-09-10. Accessed 2026-11-05.
- [25] Florida Legislature. Florida Statutes 489.105, Definitions (2026). 2026 Florida Statutes. Accessed 2026-11-05.
- [26] NYSERDA. Doing Solar Business in New York, archived copy. Snapshot 2026-08-13. Accessed 2026-11-05.
- [27] Pennsylvania Department of Labor and Industry. Contractor Licensing. Current page. Accessed 2026-11-05.
- [28] Illinois General Assembly, JCAR. 83 Ill. Adm. Code 468.30, Applicability (Distributed Generation Installer Certification), archived copy. Rule in force since 2014. Accessed 2026-11-05.
- [29] Ohio Construction Industry Licensing Board. OCILB Testing Application. Form revised 9/2025. Accessed 2026-11-05.
- [30] Georgia Attorney General, Consumer Protection Division. What kind of licensing is a solar panel installer required to have?. 2021-07-02. Accessed 2026-11-05.
- [31] North Carolina General Assembly. N.C. Gen. Stat. 87-43, Electrical contracting defined; licenses, archived copy. Snapshot 2026-01-26. Accessed 2026-11-05.
- [32] NC State Board of Examiners of Electrical Contractors. Licensing (license scope and classification). Current page. Accessed 2026-11-05.
- [33] Michigan Department of Licensing and Regulatory Affairs. Large-Scale Solar Photovoltaic Projects, archived copy. Snapshot 2026-07-10. Accessed 2026-11-05.
Tier 2: trade bodies, market research, company data (5)
- [16] Interstate Renewable Energy Council (IREC). National Solar Jobs Census 2024, archived copy. 2024. Accessed 2026-11-03.
- [17] Interstate Renewable Energy Council (IREC). National Solar Jobs Census 2024: Solar Jobs by State, archived copy. 2024; published November 2025. Accessed 2026-11-05.
- [18] Interstate Renewable Energy Council (IREC). National Solar Jobs Census 2024 state dataset (Datawrapper CSV). 2019 to 2024. Accessed 2026-11-05.
- [19] Interstate Renewable Energy Council (IREC). Invitation to Sponsor the 16th National Solar Jobs Census Report, archived copy. September 2026. Accessed 2026-11-05.
- [34] Interstate Renewable Energy Council (IREC). National Solar Licensing Database, archived copy. Last updated December 2022. Accessed 2026-11-05.